Open Access
Fig. 11
Download original image
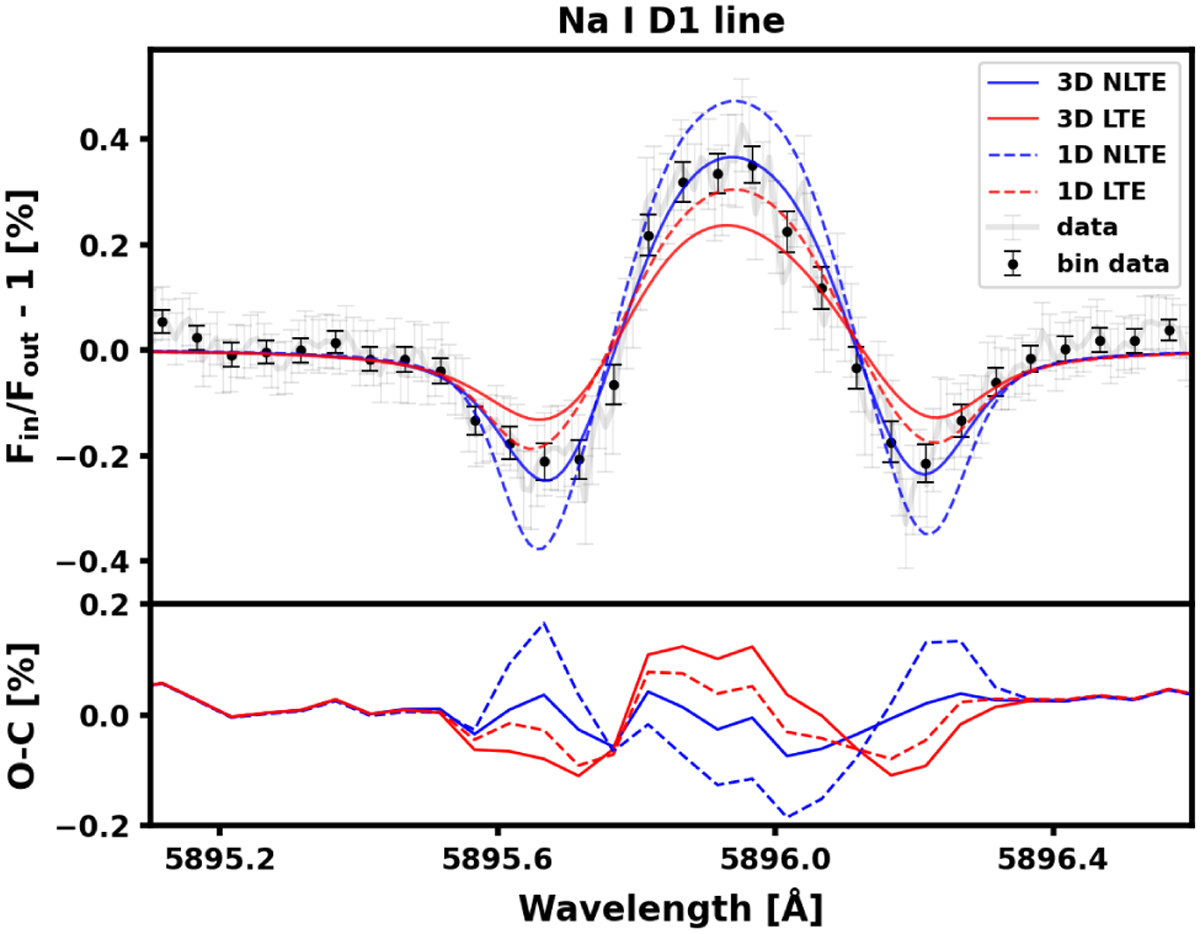
Transmission spectrum of HD 209458b centered on the Na I D1 line, compared with models of the CLV+RM effect from synthetic stellar spectra, colored as in the figure legend. We show in the bottom panel the difference between the binned data and the models.
Current usage metrics show cumulative count of Article Views (full-text article views including HTML views, PDF and ePub downloads, according to the available data) and Abstracts Views on Vision4Press platform.
Data correspond to usage on the plateform after 2015. The current usage metrics is available 48-96 hours after online publication and is updated daily on week days.
Initial download of the metrics may take a while.