Fig. 9
Download original image
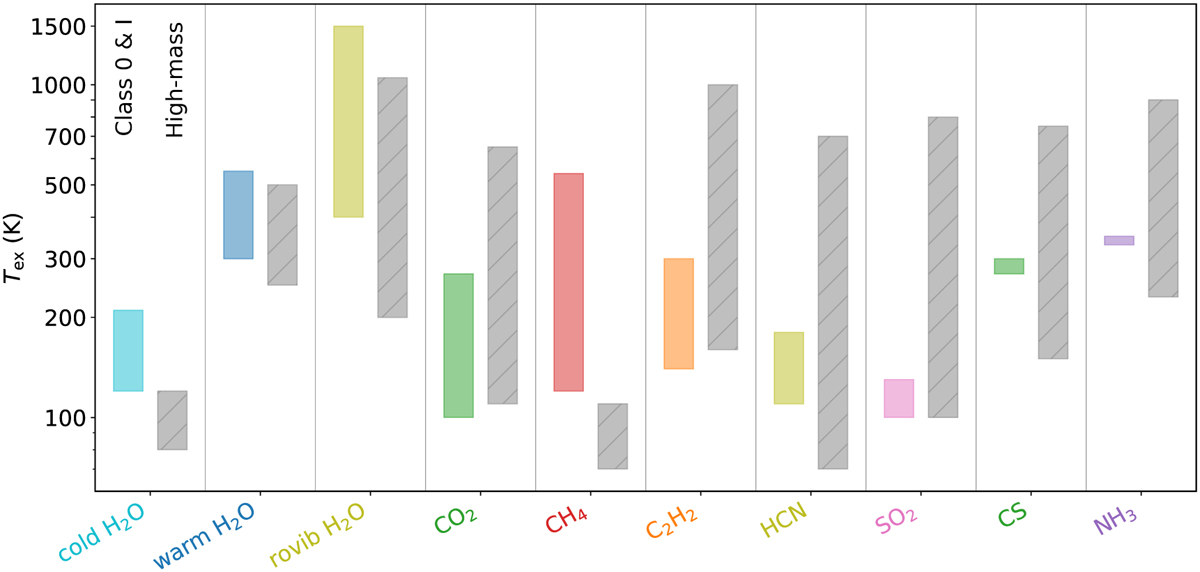
Range in excitation temperatures (shaded colored areas) for all detected species measured toward the embedded low-mass protostellar systems in the JOYS sample. For each species, the range measured toward high-mass sources is presented in the shaded gray areas (Boogert et al. 1998; Lahuis & van Dishoeck 2000; Keane et al. 2001; Boonman et al. 2003; Knez et al. 2009; Karska et al. 2014; Dungee et al. 2018; Barr et al. 2018, 2020; Nickerson et al. 2023; Francis et al. 2024). Since for no data are available for SiO and C4H2 in high-mass sources, these are not displayed.
Current usage metrics show cumulative count of Article Views (full-text article views including HTML views, PDF and ePub downloads, according to the available data) and Abstracts Views on Vision4Press platform.
Data correspond to usage on the plateform after 2015. The current usage metrics is available 48-96 hours after online publication and is updated daily on week days.
Initial download of the metrics may take a while.