Fig. 8
Download original image
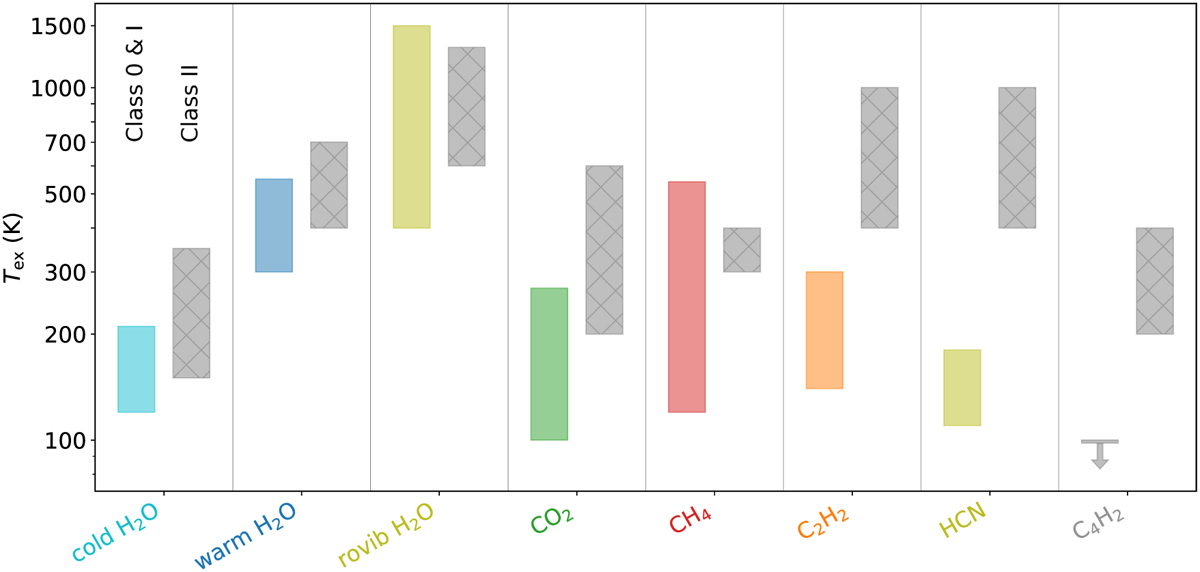
Range in excitation temperatures (shaded colored areas) for all detected species toward the embedded low-mass protostellar systems in the JOYS sample. For each species, the measured range of more evolved Class II sources is presented in the shaded gray areas (Salyk et al. 2011; Grant et al. 2023; Gasman et al. 2023; Tabone et al. 2023; Temmink et al. 2024a; Schwarz et al. 2024; Arabhavi et al. 2024). Since no data are available for SiO, SO2, CS, and NH3 in Class II sources, these are not displayed. It is evident that the molecular features in Class 0&I sources are tracing colder regions than in Class II sources, although the number of detections in embedded sources remains limited.
Current usage metrics show cumulative count of Article Views (full-text article views including HTML views, PDF and ePub downloads, according to the available data) and Abstracts Views on Vision4Press platform.
Data correspond to usage on the plateform after 2015. The current usage metrics is available 48-96 hours after online publication and is updated daily on week days.
Initial download of the metrics may take a while.