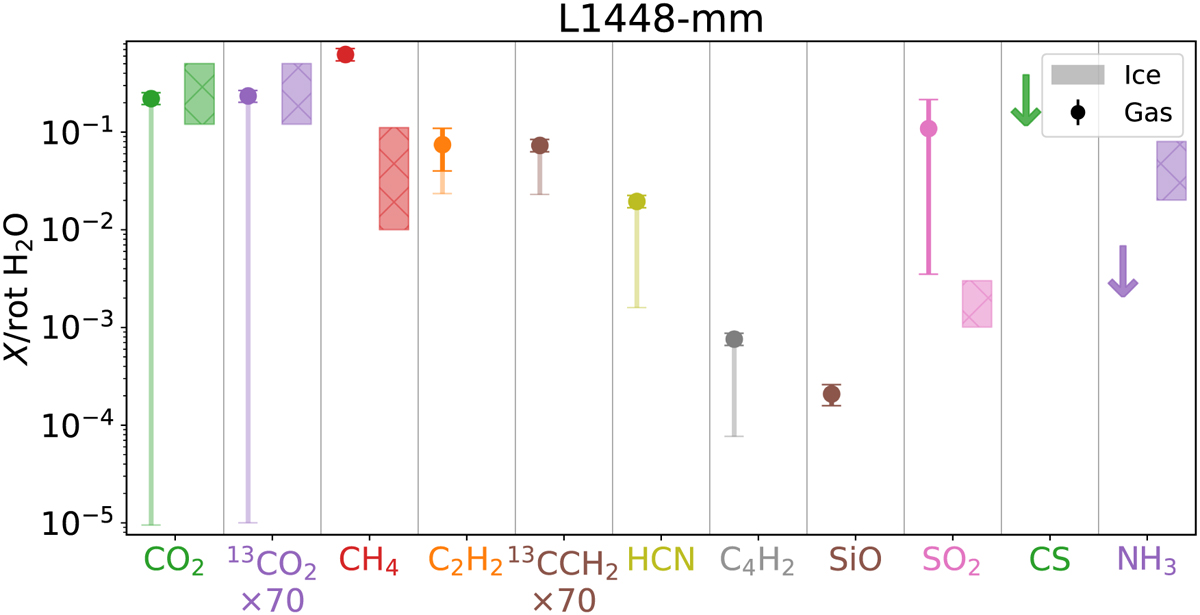
Fig. 7
Download original image
Abundance ratios in of several detected molecules (colored datapoints) with respect to the total number of molecules of H2O derived from the pure rotational lines (cold + warm components) toward L1448-mm. The datapoints of 13CO2 and 13CCH2 are multiplied by 70 to take into account the 12C/13C ratio of the local ISM (Milam et al. 2005). The larger lighter error bars indicate the range of the abundance ratios when IR pumping is taken into account. The range of column density ratios detected in the ices for all low-mass protostellar systems (i.e., not limited to L1448-mm or other JOYS sources) are displayed as the shaded colored area for each species with a confirmed ice detection (Boogert et al. 2015; Rocha et al. 2024; Chen et al. 2024).
Current usage metrics show cumulative count of Article Views (full-text article views including HTML views, PDF and ePub downloads, according to the available data) and Abstracts Views on Vision4Press platform.
Data correspond to usage on the plateform after 2015. The current usage metrics is available 48-96 hours after online publication and is updated daily on week days.
Initial download of the metrics may take a while.