Fig. 5
Download original image
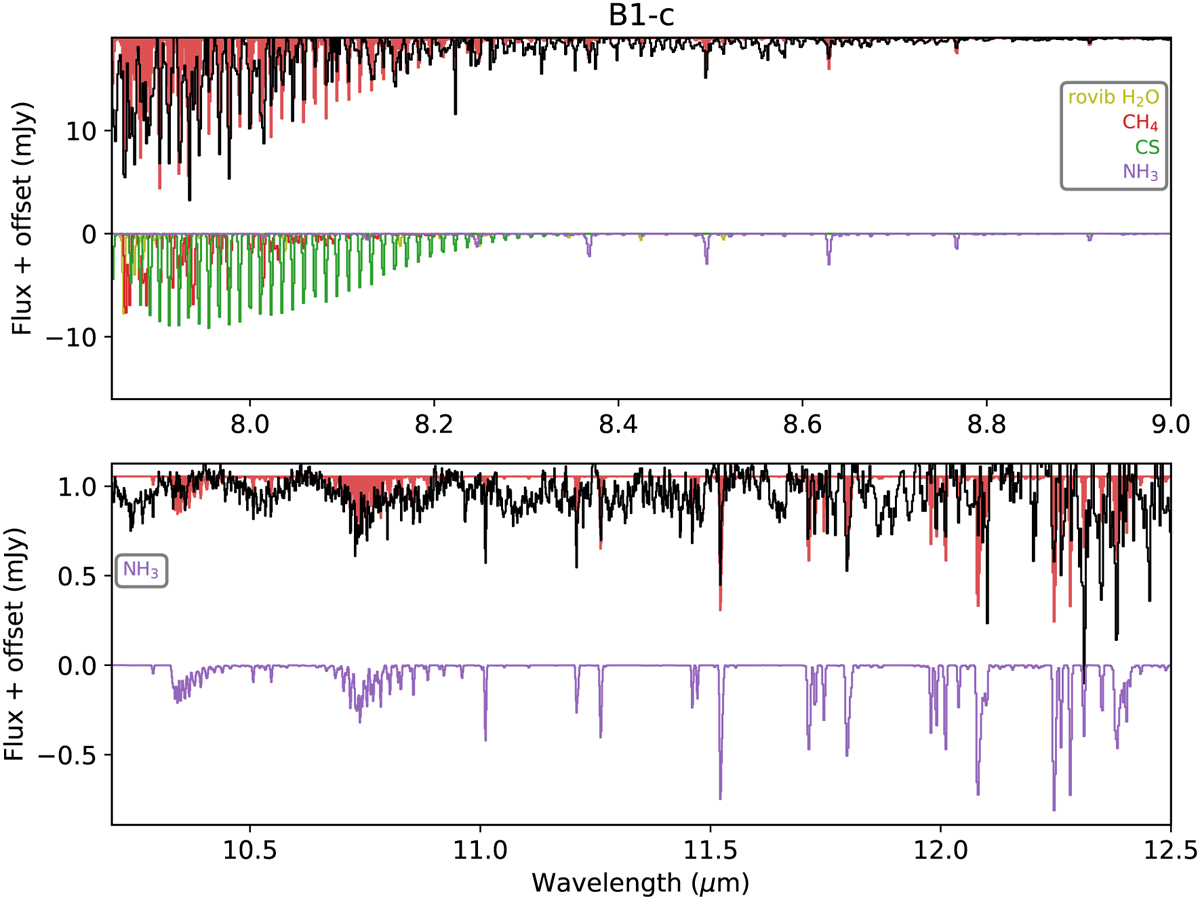
Baseline-subtracted spectrum (black) and best-fit LTE model (shaded red) for B1-c in the 8.2-12.5 µm range. At the bottom of each panel, the individual best-fit LTE models of rovibrational H2O (yellow), CH4 (red), CS (green), and NH3 (purple) are shown at an arbitrary constant offset. Deep negative absorption features originating from detector artifacts are clipped for clarity. Between 10-12 µm, some features of NH3 are over or under reproduced, but the S/N at these wavelengths is low due to the strong absorption by the silicate and H2O ice libration bands.
Current usage metrics show cumulative count of Article Views (full-text article views including HTML views, PDF and ePub downloads, according to the available data) and Abstracts Views on Vision4Press platform.
Data correspond to usage on the plateform after 2015. The current usage metrics is available 48-96 hours after online publication and is updated daily on week days.
Initial download of the metrics may take a while.