Fig. 2
Download original image
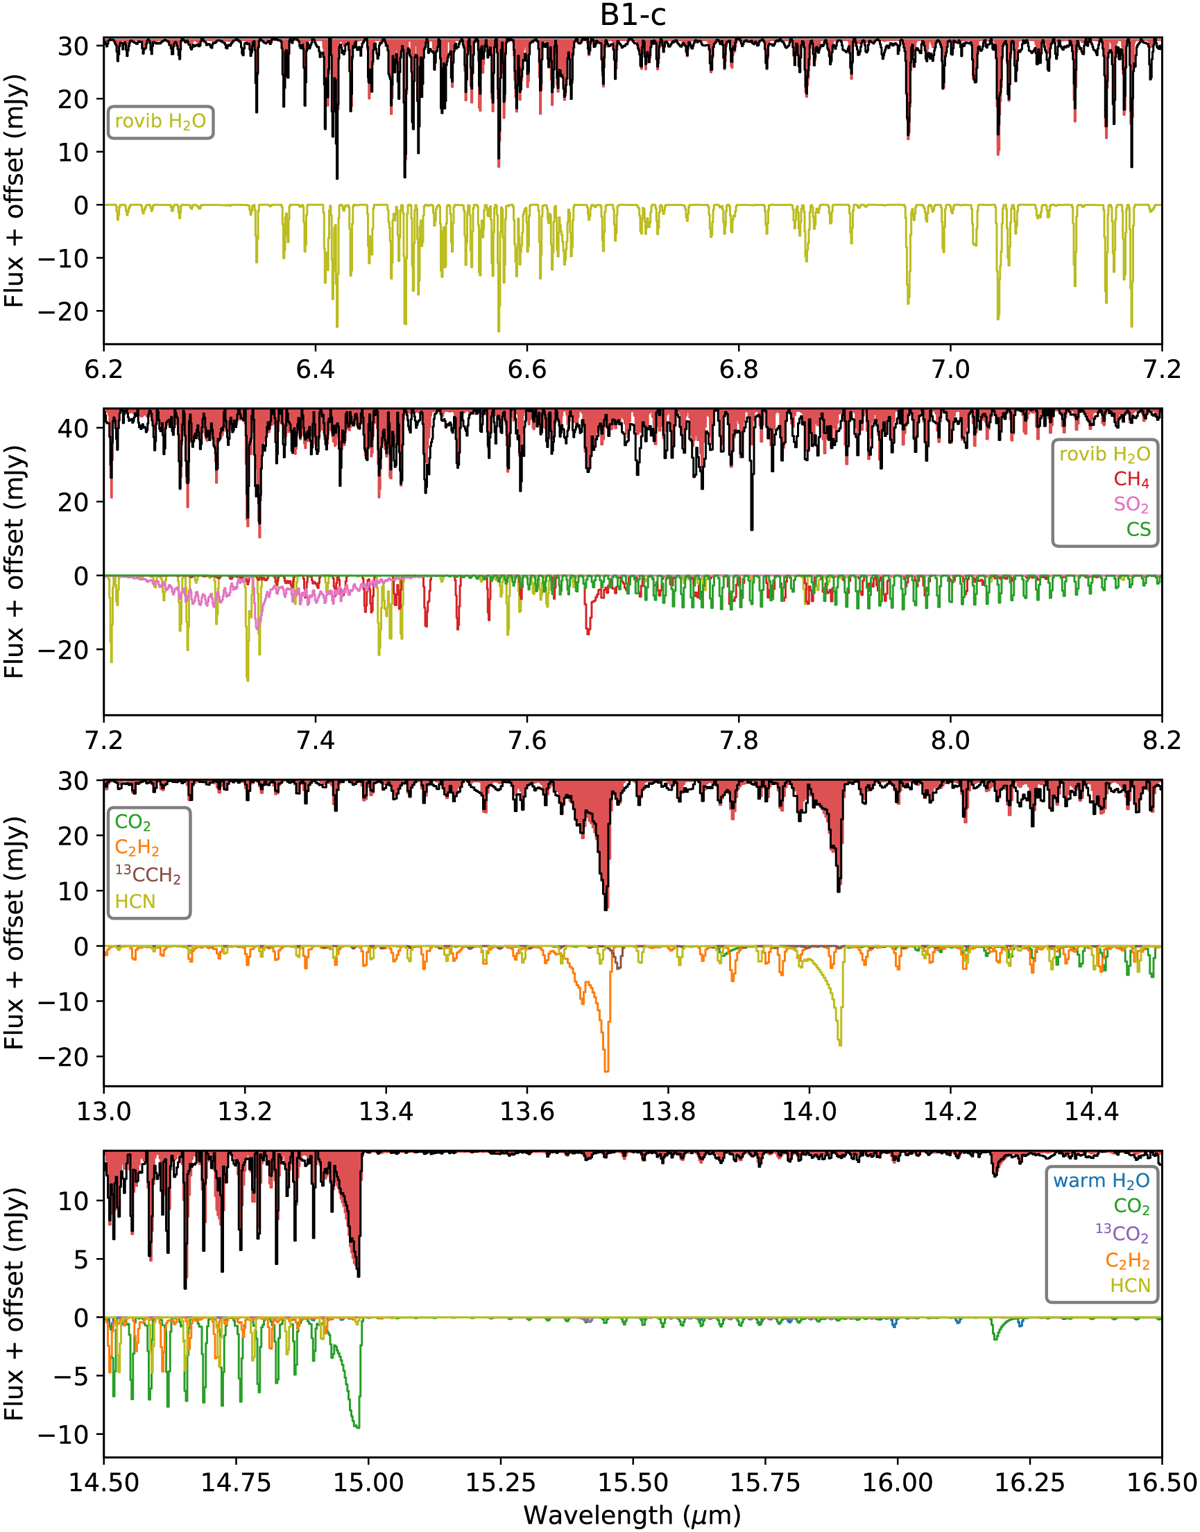
Overview of the main molecular absorption features detected toward B1-c in the MIRI-MRS wavelength range. In each panel, the baseline-subtracted spectrum is shown in black and the best-fit LTE model including all molecules listed is overlaid as the shaded red area. At the bottom of each panel, the individual best-fit LTE models of all molecules contributing to the corresponding wavelength range are displayed at an arbitrary constant offset, with each color denoting a different species. The surprising detection of NH3 toward B1-c is highlighted in Fig. 5.
Current usage metrics show cumulative count of Article Views (full-text article views including HTML views, PDF and ePub downloads, according to the available data) and Abstracts Views on Vision4Press platform.
Data correspond to usage on the plateform after 2015. The current usage metrics is available 48-96 hours after online publication and is updated daily on week days.
Initial download of the metrics may take a while.