Fig. 1
Download original image
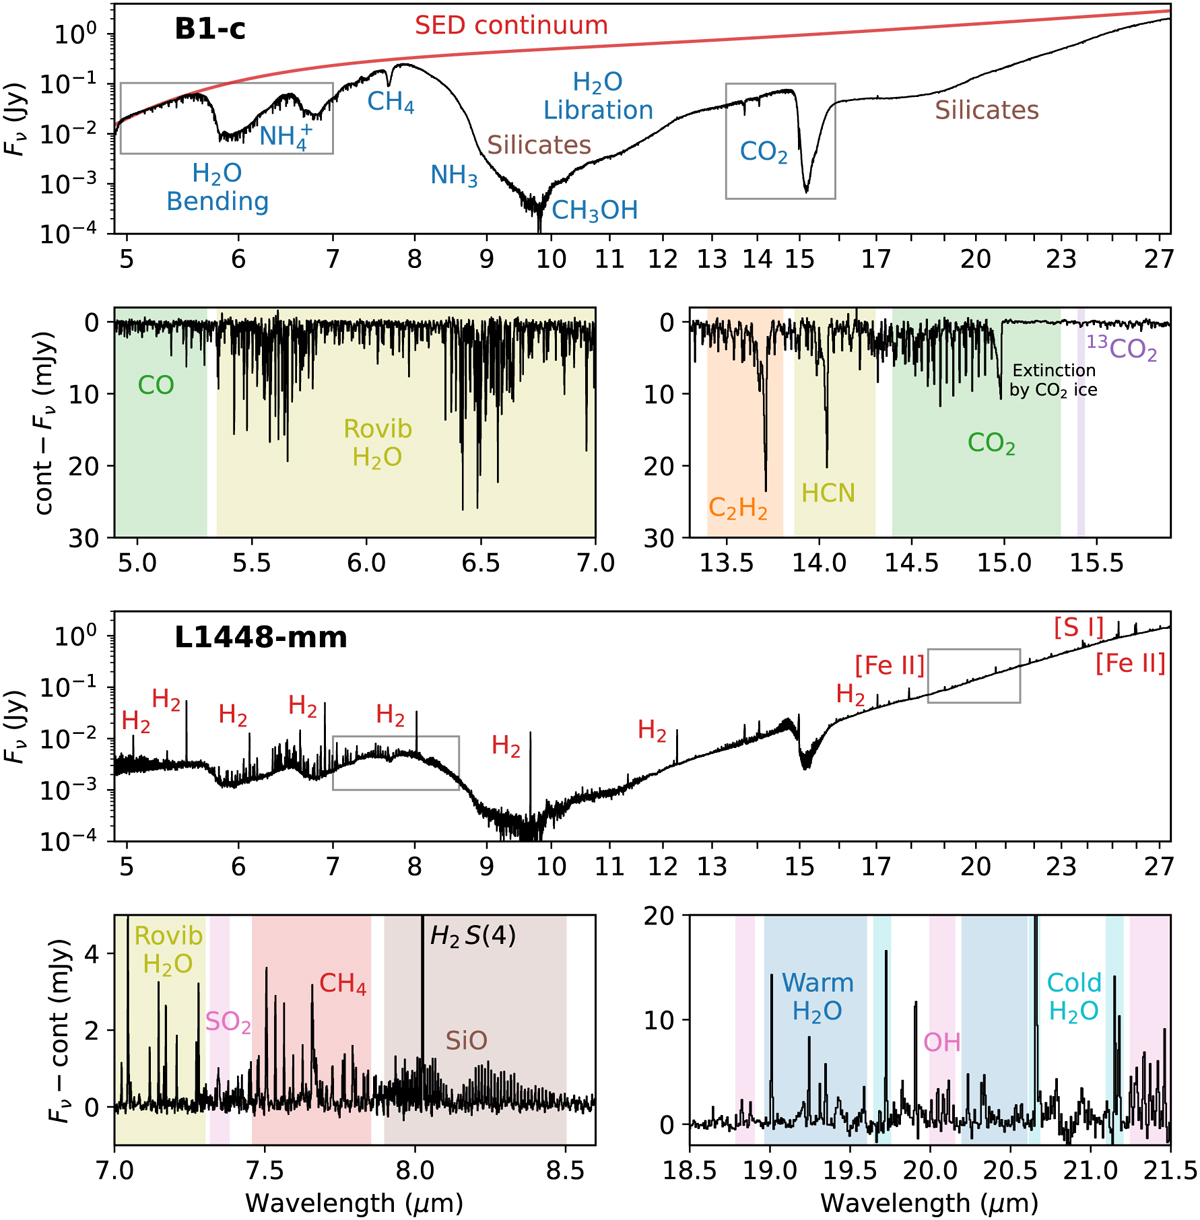
Spectra of B1-c (top row) and L1448-mm (third row) and the main spectral features detected among the JOYS data of these two sources (two panels per source below the full spectrum). In the top spectrum of B1-c, the SED continuum fit is shown in red and dominant ice and silicate absorption features are labeled in blue and brown, respectively. The two gray boxes mark the spectral range covered in the two insets in the second row. The baseline-subtracted absorption spectra of B1-c are presented in the second row, highlighting the CO and rovibrational H2O features between 4.9–7.0 µm and the CO2, 13CO2, C2H2, and HCN features between 13.3–15.9 µm. The third row shows the spectrum of L1448-mm with dominant emission lines of H2, [S I], and [Fe II] labeled in red. The bottom row shows the baseline-subtracted emission spectra from the two gray boxes, focusing on the rovibrational H2O, SO2, CH4, and SiO features between 7.0–8.6 µm and the pure rotational lines of H2O and OH between 18.5–21.5 µm.
Current usage metrics show cumulative count of Article Views (full-text article views including HTML views, PDF and ePub downloads, according to the available data) and Abstracts Views on Vision4Press platform.
Data correspond to usage on the plateform after 2015. The current usage metrics is available 48-96 hours after online publication and is updated daily on week days.
Initial download of the metrics may take a while.