Fig. 7.
Download original image
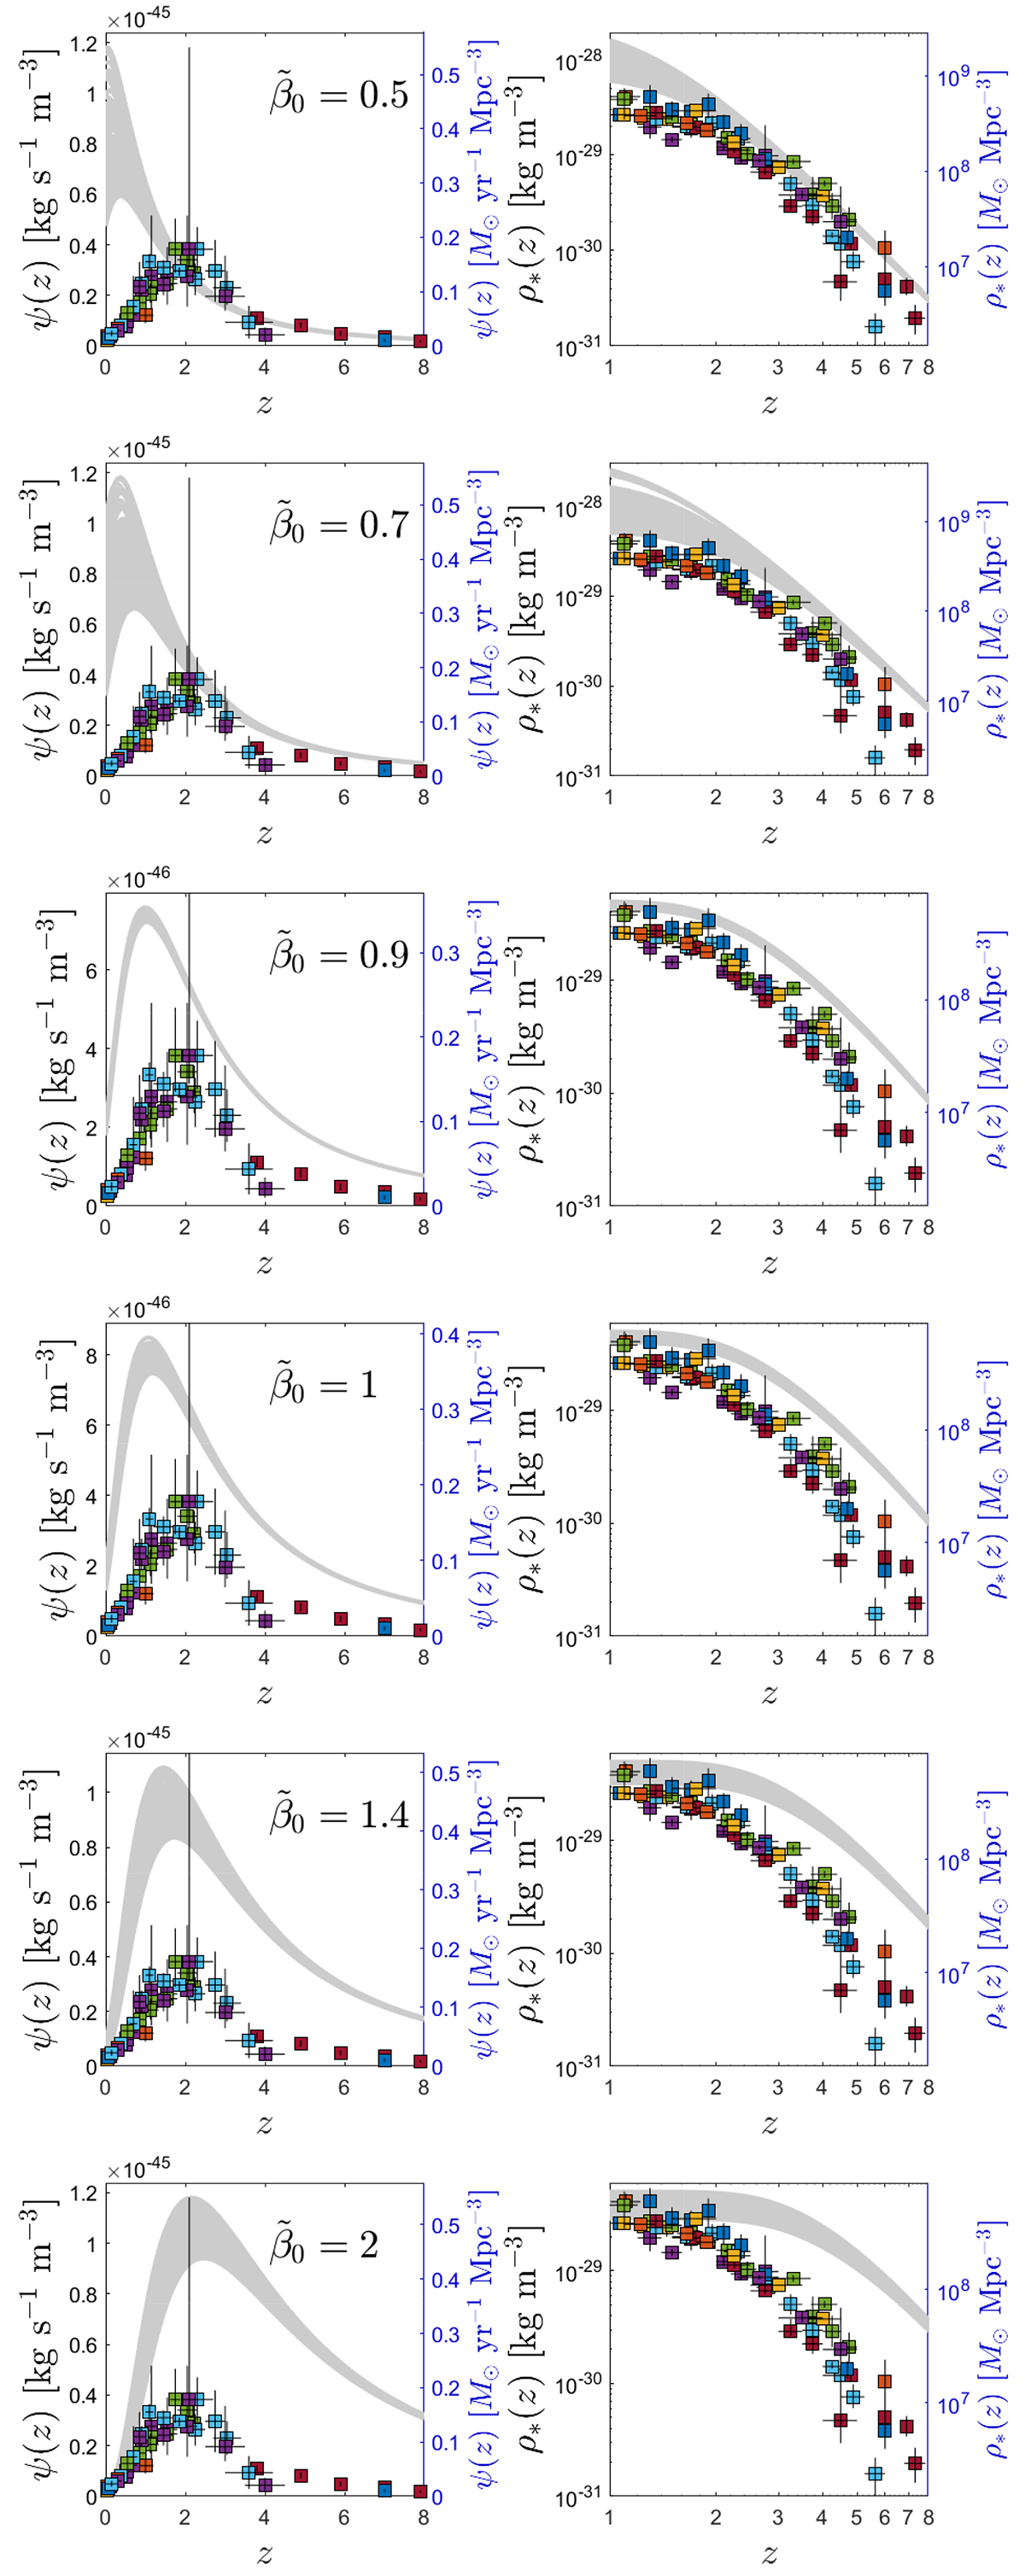
Effect of ![]() on SFR and integrated stellar densities. (Left column) Experimentally reported ψ(z) (symbols) and ψGSL(z) according to Eq. (87) (family of gray lines) as well as (right column) reported ρ*(z) (symbols) and ρGSL*(z) according to Eq. (90) (family of gray lines) for h70 = 1 and various
on SFR and integrated stellar densities. (Left column) Experimentally reported ψ(z) (symbols) and ψGSL(z) according to Eq. (87) (family of gray lines) as well as (right column) reported ρ*(z) (symbols) and ρGSL*(z) according to Eq. (90) (family of gray lines) for h70 = 1 and various ![]() (increasing from top to bottom). The families had been created using 1000 randomly chosen, but eligible (r1, r2), pairs for given
(increasing from top to bottom). The families had been created using 1000 randomly chosen, but eligible (r1, r2), pairs for given ![]() (specified in the panels). The eligible pairs reside in the green regions of the corresponding panel in Fig. 6. We note that for
(specified in the panels). The eligible pairs reside in the green regions of the corresponding panel in Fig. 6. We note that for ![]() and
and ![]() no green regions exist; not all constraints could be fulfilled. For those two values, the eligible pairs are from the blue regions.
no green regions exist; not all constraints could be fulfilled. For those two values, the eligible pairs are from the blue regions.
Current usage metrics show cumulative count of Article Views (full-text article views including HTML views, PDF and ePub downloads, according to the available data) and Abstracts Views on Vision4Press platform.
Data correspond to usage on the plateform after 2015. The current usage metrics is available 48-96 hours after online publication and is updated daily on week days.
Initial download of the metrics may take a while.