Fig. 6
Download original image
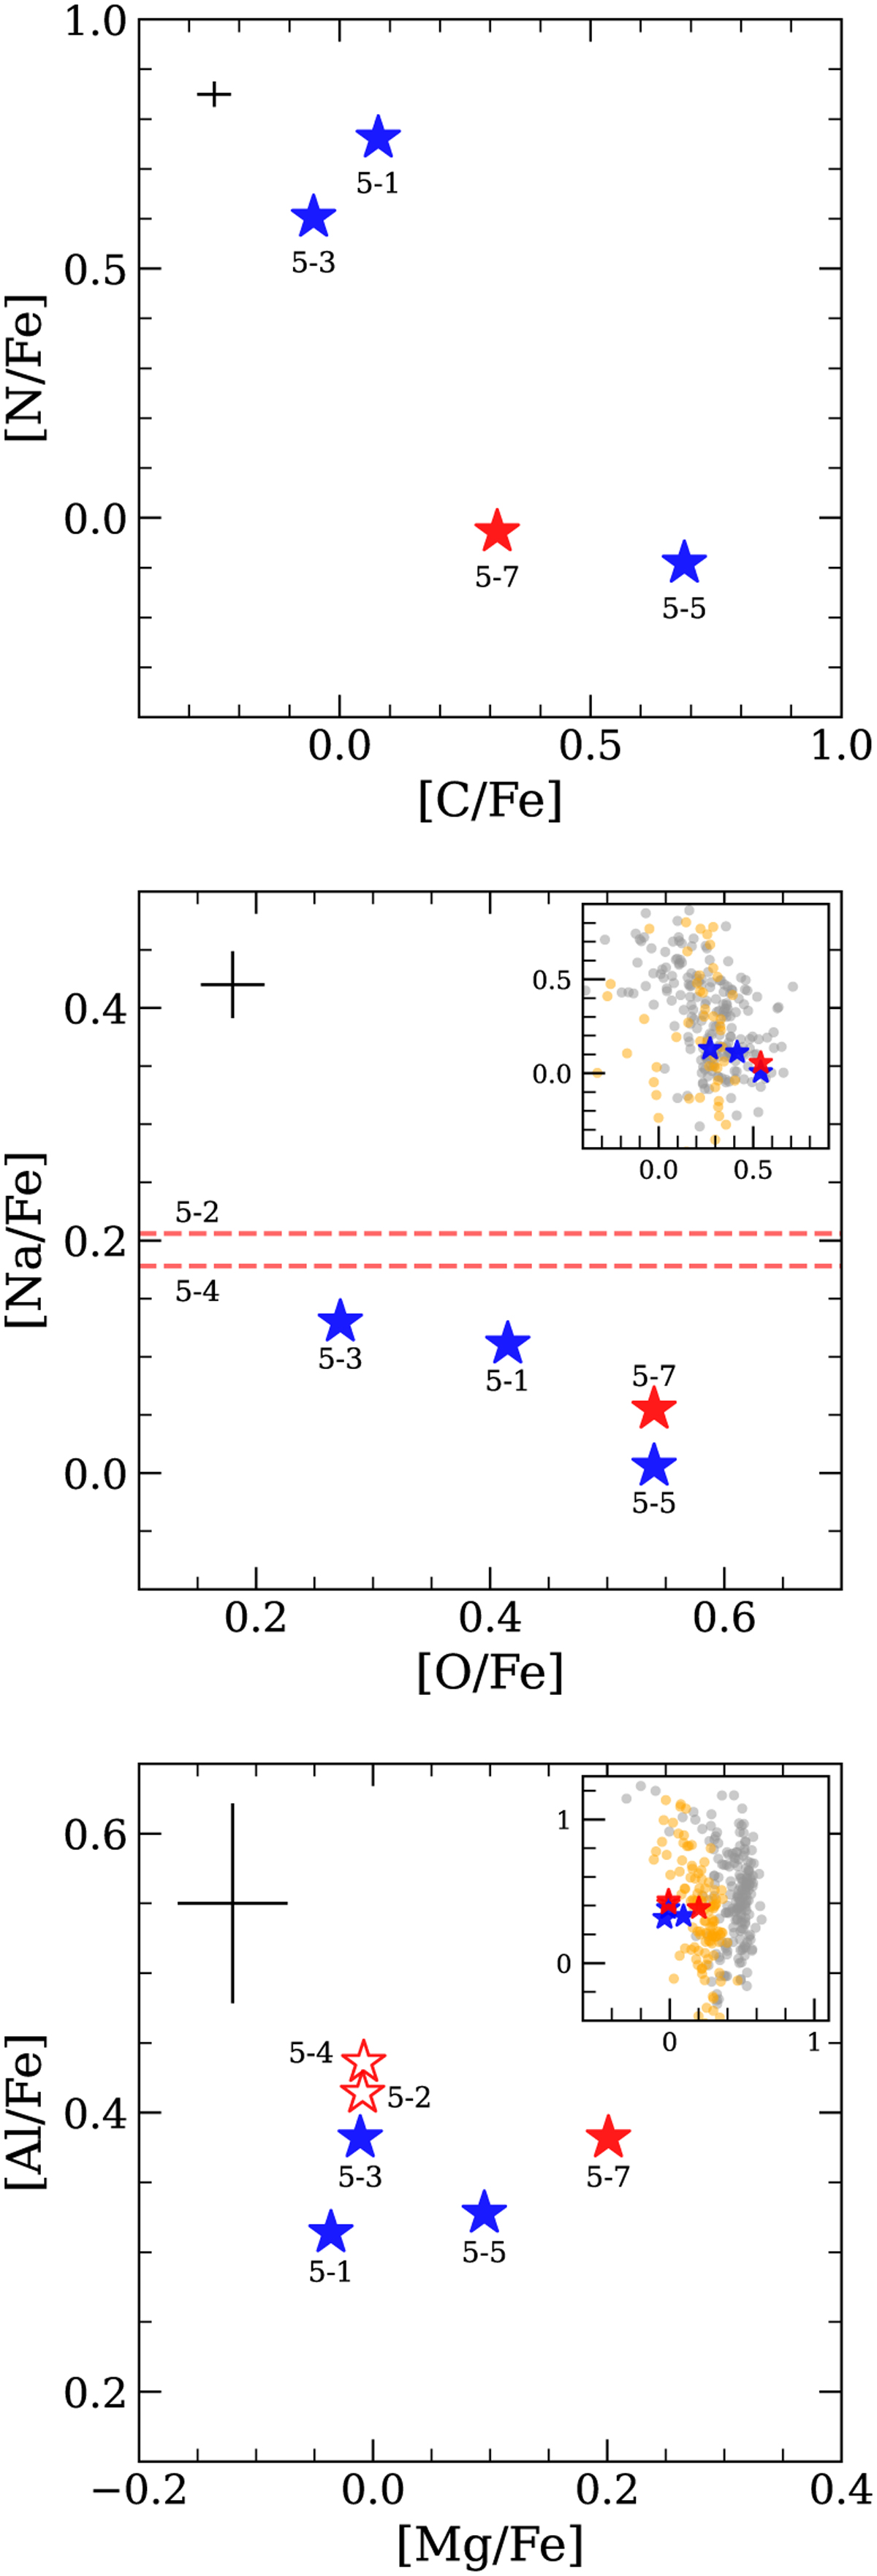
Distributions of the stars in Gran 5 in the [N/Fe] vs. [C/Fe] (upper), [Na/Fe] vs. [O/Fe] (middle), and [Al/Fe] vs. [Mg/Fe] (lower) plots. The blue and red symbols indicate metal-rich and metal-poor populations, respectively, as divided in Sect. 4.1. Gran 5-2 and Gran 5-4 are represented as open symbols only in the lower panel, and their [Na/Fe] abundance ratios are indicated by dashed red lines in the middle panel because we lack C, N, and O abundance data. The mean measurement error for each element (±1σ) is plotted in the upper left corner of each panel. The inset panels in the middle and lower panels provide zoomed- out views for comparison with stars in other GCs. The gray circles represent data from 17 GCs derived from optical spectroscopy (Carretta et al. 2009), and the yellow circles correspond to stars in NGC 6304 and NGC 6273 obtained from the APOGEE catalog by Schiavon et al. (2024).
Current usage metrics show cumulative count of Article Views (full-text article views including HTML views, PDF and ePub downloads, according to the available data) and Abstracts Views on Vision4Press platform.
Data correspond to usage on the plateform after 2015. The current usage metrics is available 48-96 hours after online publication and is updated daily on week days.
Initial download of the metrics may take a while.