Fig. 5
Download original image
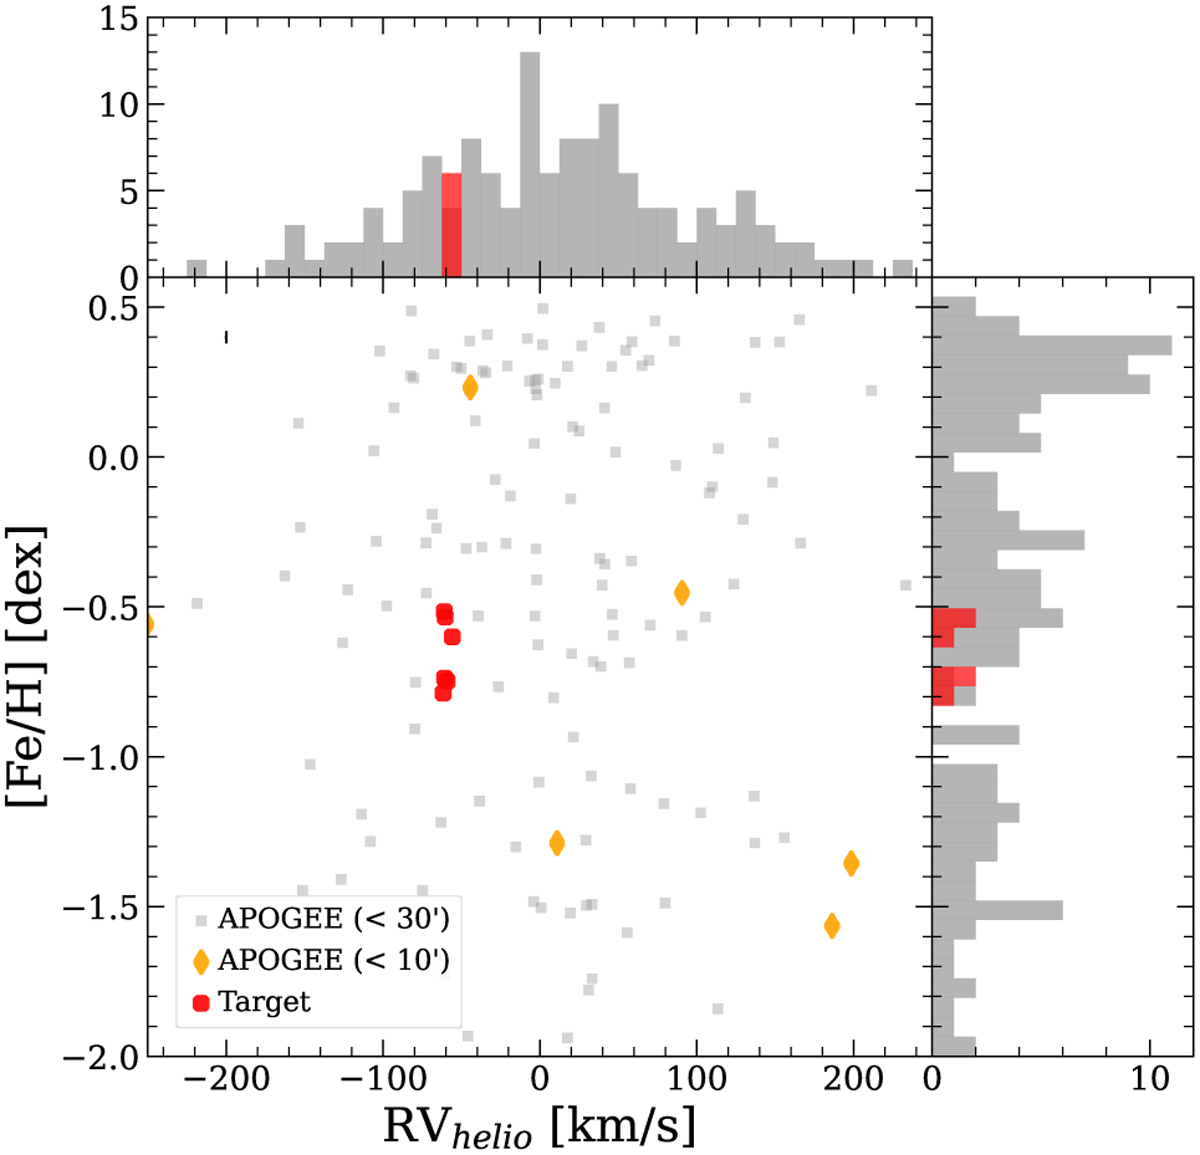
Comparison of our target stars (red circles) to the nearby field stars from APOGEE (gray squares) on the [Fe/H] - RVhelio plane. The upper and right panels show histograms of RVhelio and [Fe/H], respectively. While our target stars fall into the same bin in the histogram of RVhelio, they can be divided into two metallicity groups in the histogram of [Fe/H]. The mean error is plotted in the upper left corner, although it is comparable to the marker size. The yellow diamonds represent APOGEE sample stars located within 10′ from the center of Gran 5. However, none of these stars appears to be a member of Gran 5 based on their position in this plane.
Current usage metrics show cumulative count of Article Views (full-text article views including HTML views, PDF and ePub downloads, according to the available data) and Abstracts Views on Vision4Press platform.
Data correspond to usage on the plateform after 2015. The current usage metrics is available 48-96 hours after online publication and is updated daily on week days.
Initial download of the metrics may take a while.