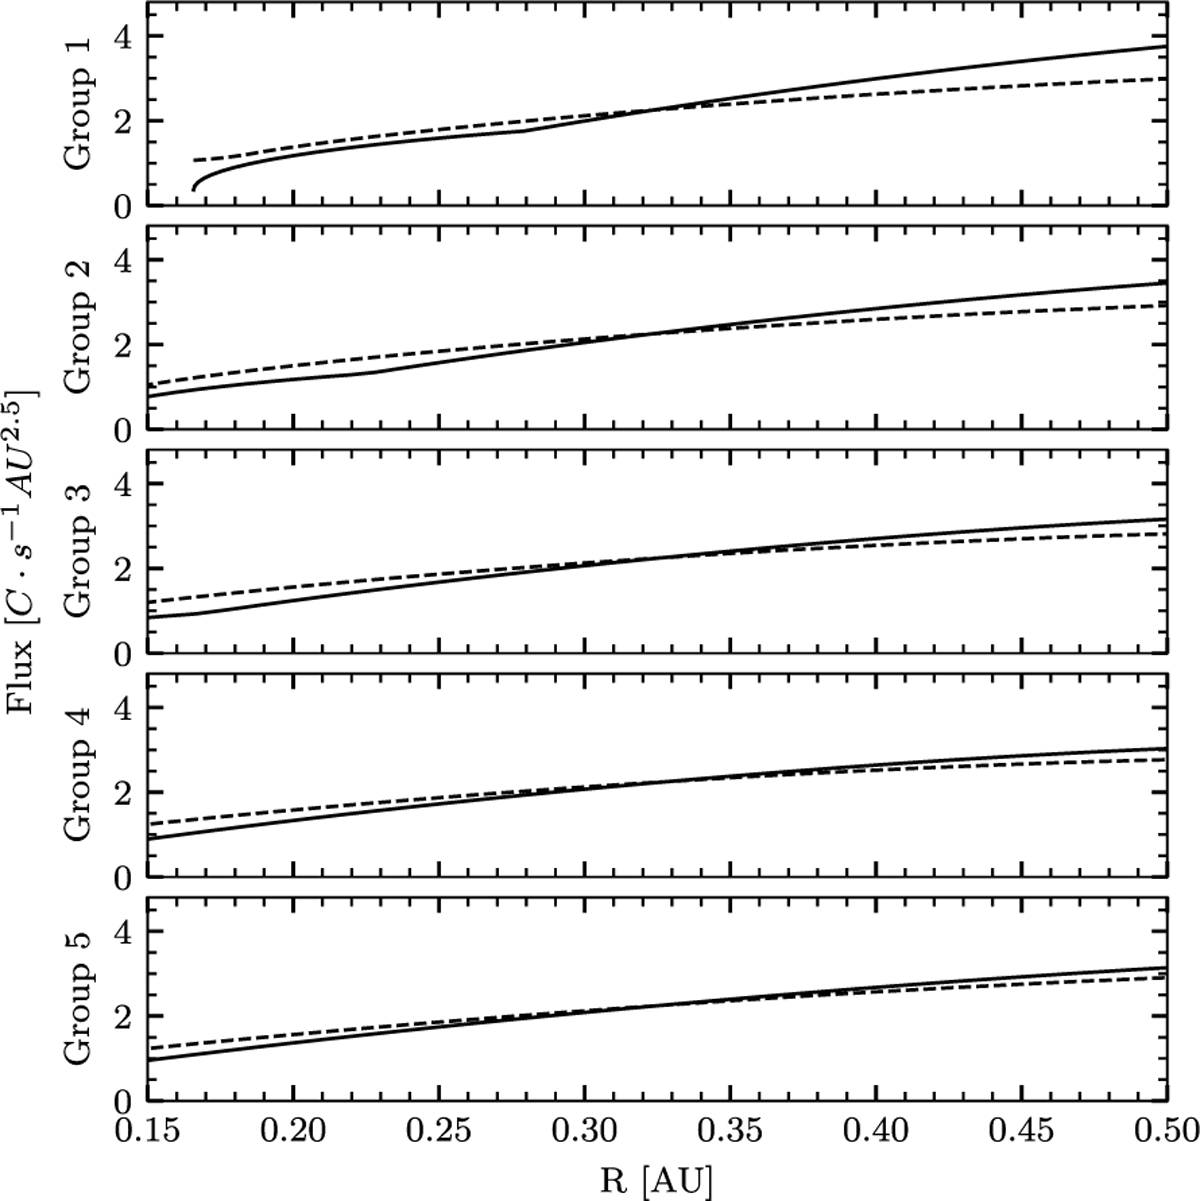
Fig. 5
Download original image
Base model-predicted flux shown with a solid line, compensated for by R−2.5. The slope is considerably shallower than oc R−2.5; hence, the inclining trend after the compensation. The model-predicted flux in the case of e = 0.5; θ = 45°; rp = 10%; β = 0.5; γ = −1.3; ϵ = 1 is shown with the dashed line. Even these rather extreme assumptions do not suffice to explain the slope observed in the data.
Current usage metrics show cumulative count of Article Views (full-text article views including HTML views, PDF and ePub downloads, according to the available data) and Abstracts Views on Vision4Press platform.
Data correspond to usage on the plateform after 2015. The current usage metrics is available 48-96 hours after online publication and is updated daily on week days.
Initial download of the metrics may take a while.