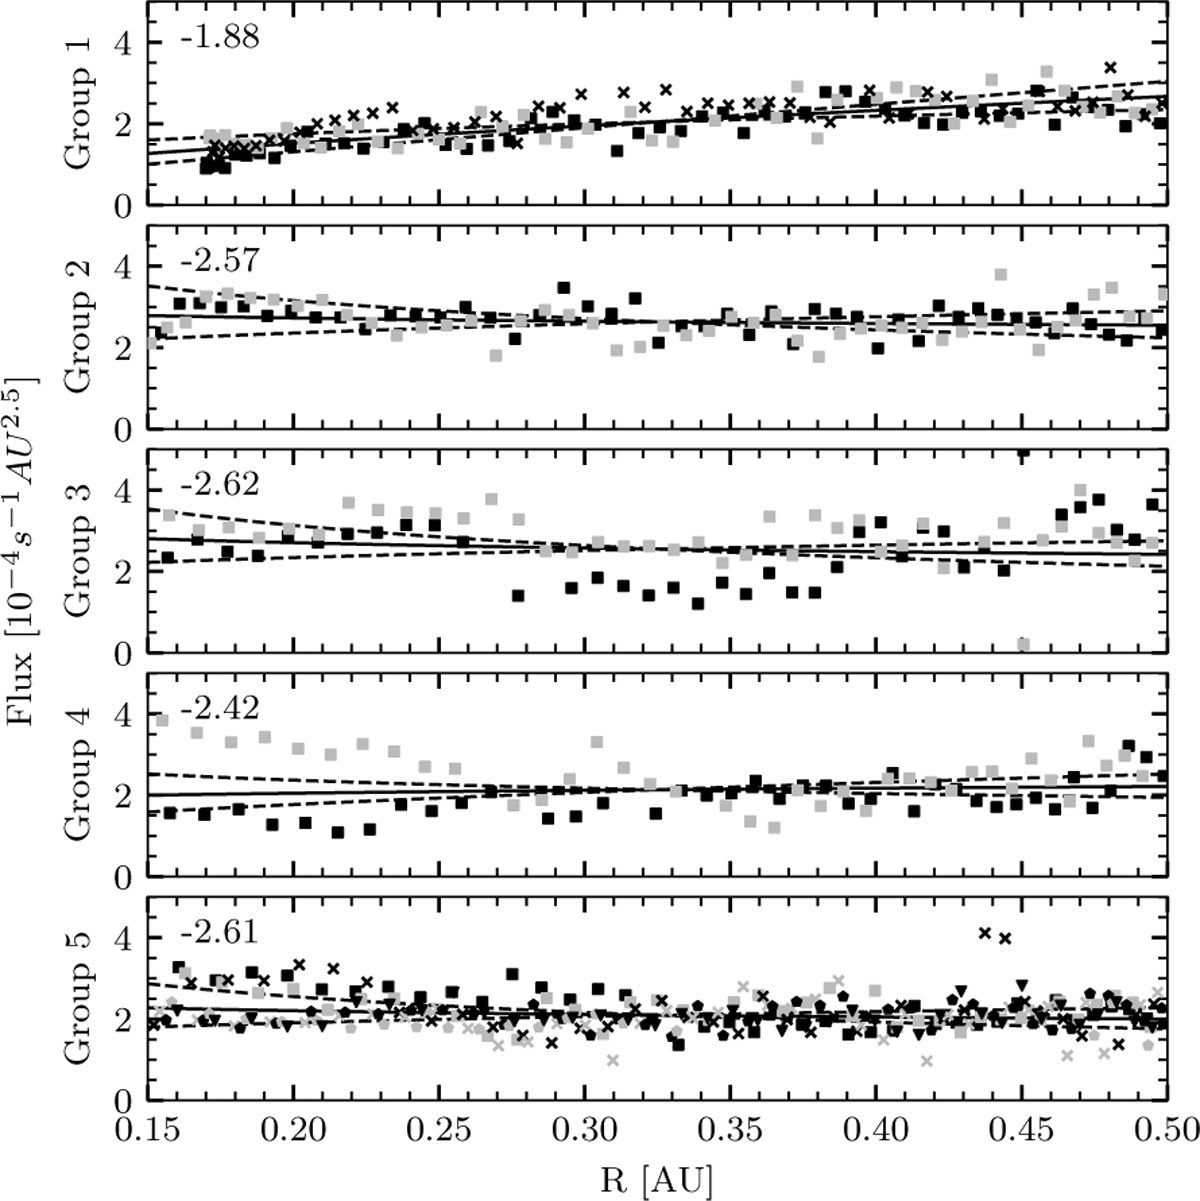
Fig. 4
Download original image
Flux as detected by PSP in the outbound part of each orbit, compensated for by R−2 5, grouped by orbital groups. Individual encounters within a group are distinguished by markers of different shape or color. The solid lines are the power-law least squares fits to the observed flux, an exponent of which is shown in the top left corner of each panel. To demonstrate the approximate accuracy of the R−2 5 scaling, the dashed lines are the power-law fits of the data, with the exponent offset by ±0.3 from the least squares fit.
Current usage metrics show cumulative count of Article Views (full-text article views including HTML views, PDF and ePub downloads, according to the available data) and Abstracts Views on Vision4Press platform.
Data correspond to usage on the plateform after 2015. The current usage metrics is available 48-96 hours after online publication and is updated daily on week days.
Initial download of the metrics may take a while.