Open Access
Fig. 3
Download original image
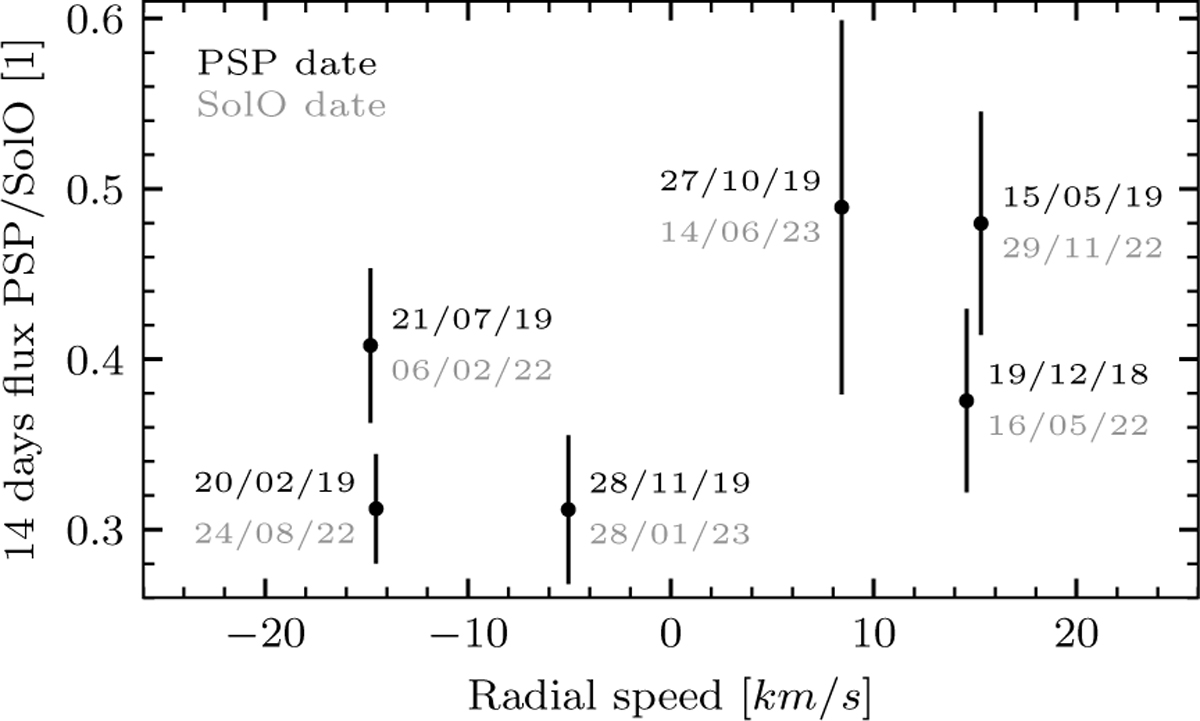
Comparison of the 14 day cumulative flux (centered on the indicated day) observed with PSP and with SolO during their near alignments. The error bars are ±σ, bootstrapped assuming Poisson distribution. See Table 1 for the heliocentric locations, velocity components, and fluxes corresponding to the individual points.
Current usage metrics show cumulative count of Article Views (full-text article views including HTML views, PDF and ePub downloads, according to the available data) and Abstracts Views on Vision4Press platform.
Data correspond to usage on the plateform after 2015. The current usage metrics is available 48-96 hours after online publication and is updated daily on week days.
Initial download of the metrics may take a while.