Fig. 8.
Download original image
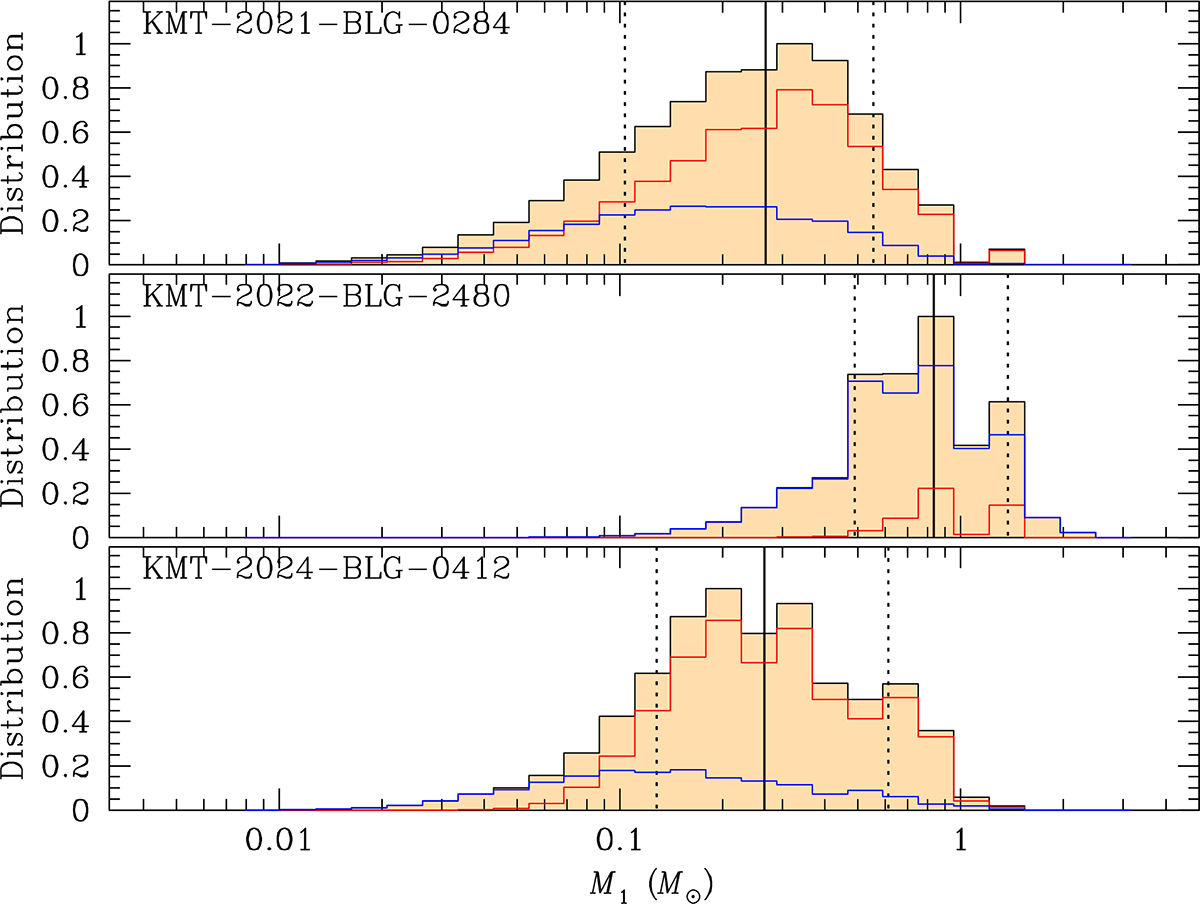
Bayesian posteriors of the mass for the heavier lens component. In each posterior, the red and blue curves illustrate the contributions from the disk and bulge lens populations, respectively, while the black curve represents the combined contributions from the two populations. The solid vertical line marks the median, and the two dotted lines denote the 1σ range of the distribution.
Current usage metrics show cumulative count of Article Views (full-text article views including HTML views, PDF and ePub downloads, according to the available data) and Abstracts Views on Vision4Press platform.
Data correspond to usage on the plateform after 2015. The current usage metrics is available 48-96 hours after online publication and is updated daily on week days.
Initial download of the metrics may take a while.