Fig. 2.
Download original image
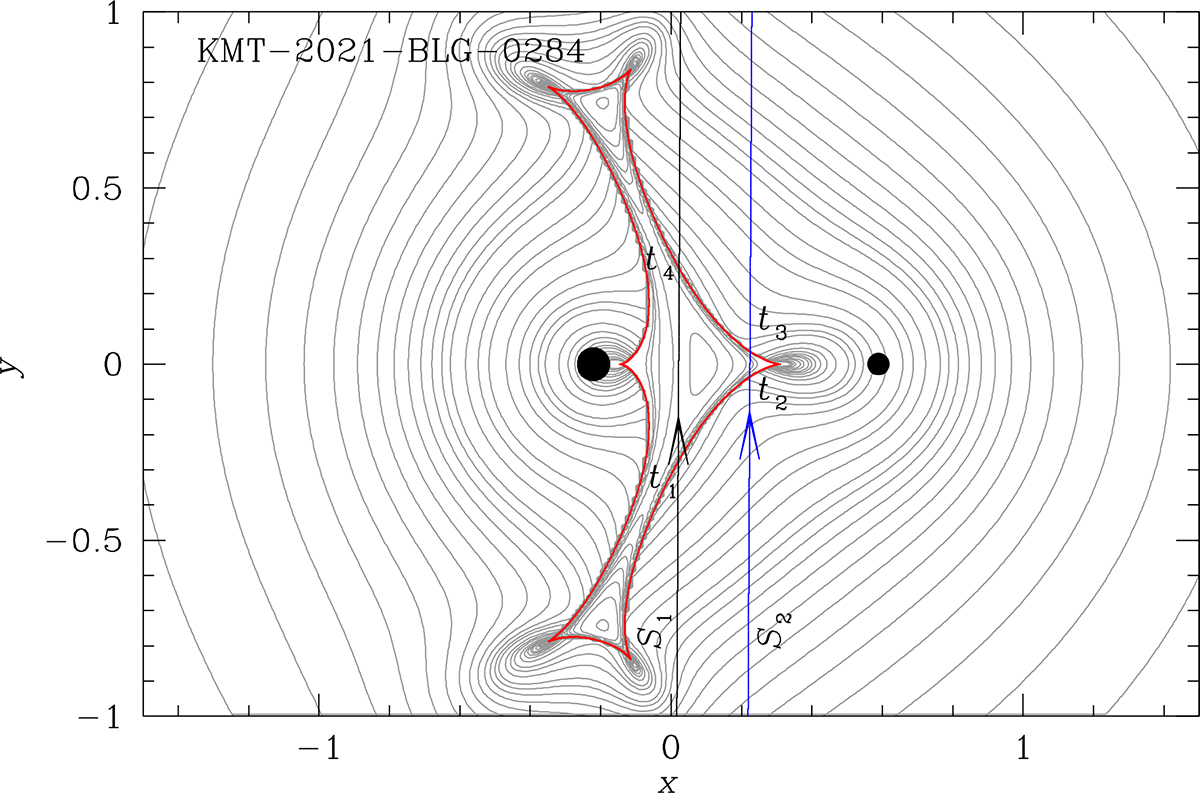
Lens system configuration of KMT-2021-BLG-0284. The red figures composed of concave curves represents the caustic. The two black filled dots indicate the positions of the lens components; the bigger one represents the heavier component. The black and blue arrowed lines represent the trajectories of the primary (S1) and secondary (S2) source stars, respectively. The arrow tips on the trajectories are shown at the same moment in time. The points marked as t1, t2, t3, and t4 on the source trajectories represent the source positions at the times of the anomalies marked in Fig. 1. Gray curves encompassing the caustic are equi-magnification contours.
Current usage metrics show cumulative count of Article Views (full-text article views including HTML views, PDF and ePub downloads, according to the available data) and Abstracts Views on Vision4Press platform.
Data correspond to usage on the plateform after 2015. The current usage metrics is available 48-96 hours after online publication and is updated daily on week days.
Initial download of the metrics may take a while.