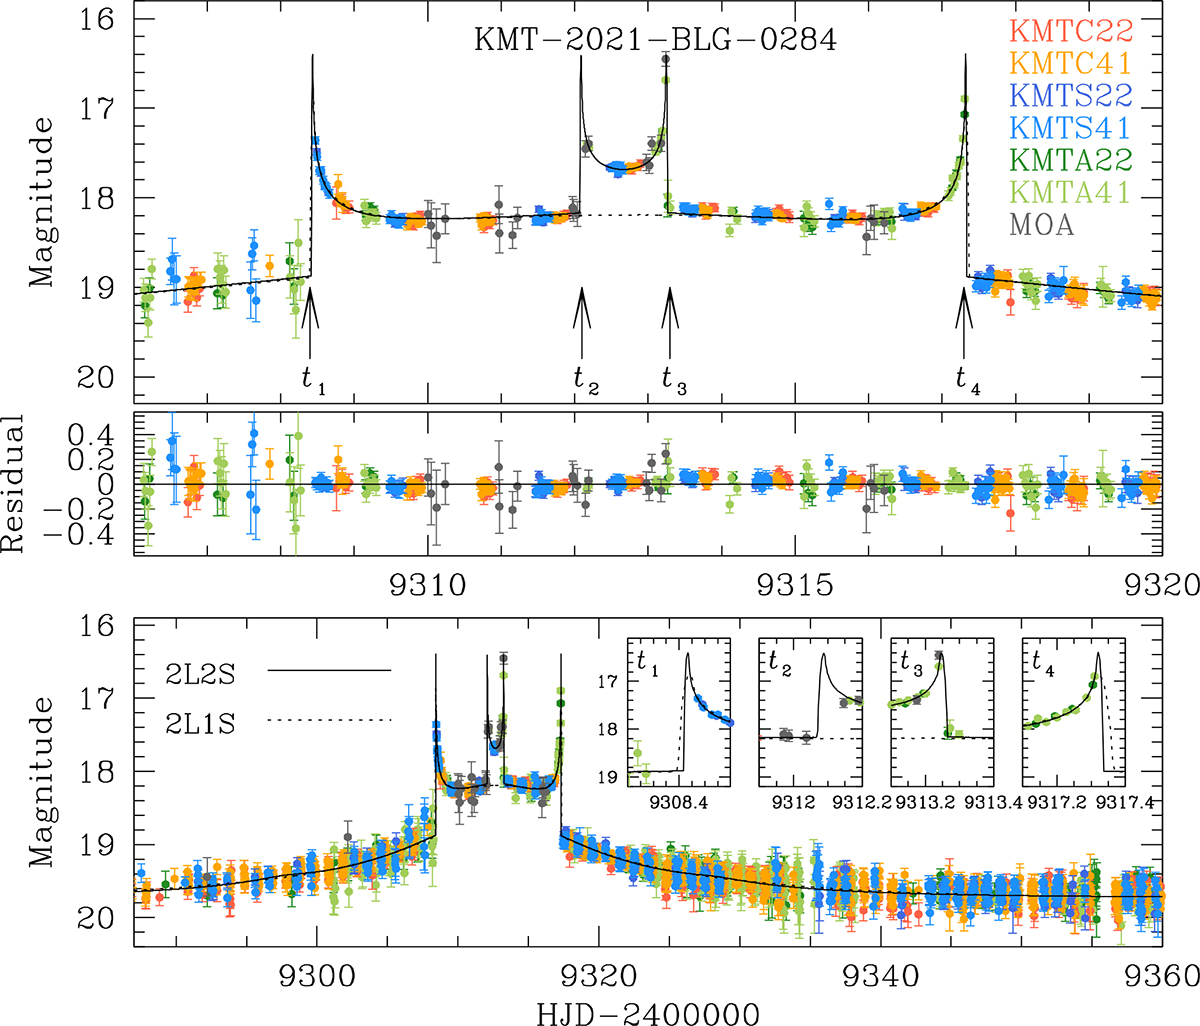
Fig. 1.
Download original image
Lensing light curve of KMT-2021-BLG-0284. The lower panel provides an overall view, while the upper panel offers a zoomed-in perspective of the anomaly region. Arrows labeled t1, t2, t3, and t4 indicate the times of the caustic-crossing features. Insets within the lower panel present an enlarged view around each individual caustic peak. The colors of the data points correspond to the telescopes and observation fields, as indicated in the legend. The solid curve overlaying the data points represents the best-fit 2L2S model, while the dotted curve depicts a 2L1S model derived by fitting the data, excluding those around t2 and t3.
Current usage metrics show cumulative count of Article Views (full-text article views including HTML views, PDF and ePub downloads, according to the available data) and Abstracts Views on Vision4Press platform.
Data correspond to usage on the plateform after 2015. The current usage metrics is available 48-96 hours after online publication and is updated daily on week days.
Initial download of the metrics may take a while.