Fig. 2.
Download original image
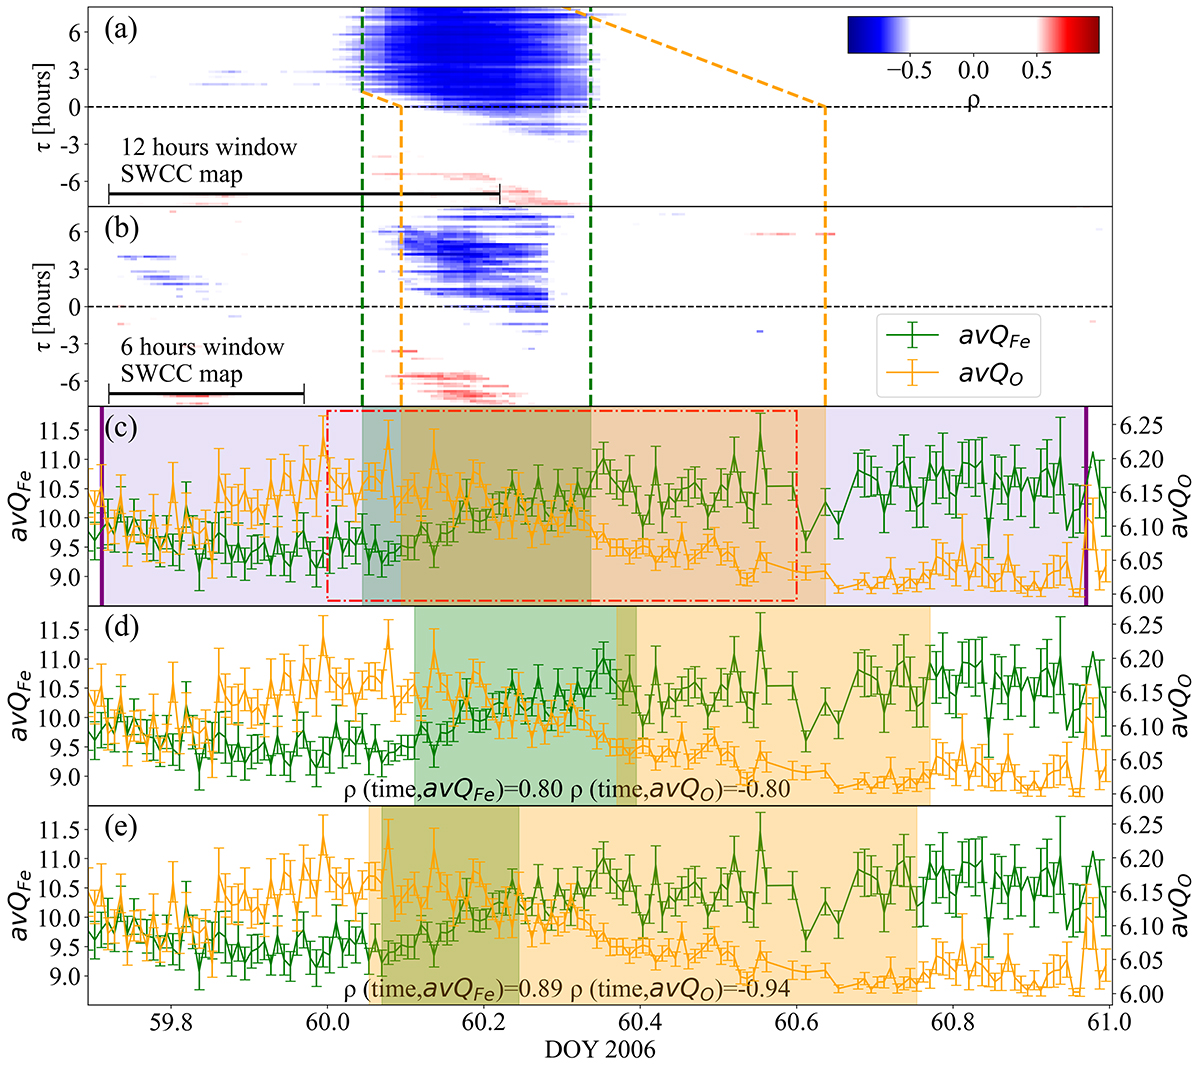
Explanation of the procedure to identify anticorrelated structures. (a) Identification procedure step 1: The sliding-window cross-correlation map with a window size of 12 hours (60 data points). The black dashed line is the baseline where time lags are zero. Colored dashed lines mark the boundaries of the blue pattern and their time stamps on the x-axis, which is the visualization of the identification procedure step 2. (b) Sliding-window cross-correlation map with a window size of 6 hours (30 data points). (c) Measured avQFe and avQO. The estimated rise phase of avQFe is shaded in green, and the fall phase of avQO is shaded in orange. Purple solid lines and the area shaded in purple mark the extended time period of interest for this structure, representing step 3 of the identification procedure, while step 4 is then a pure mathematical calculation process. The red rectangle is the same as in Fig. 1 and is indicative only (i.e., it has no physical meaning). (d) Weak solution and related correlation coefficients defined in step 5 of the identification procedure. (e) Strong solution and related correlation coefficients defined in step 5 of the identification procedure.
Current usage metrics show cumulative count of Article Views (full-text article views including HTML views, PDF and ePub downloads, according to the available data) and Abstracts Views on Vision4Press platform.
Data correspond to usage on the plateform after 2015. The current usage metrics is available 48-96 hours after online publication and is updated daily on week days.
Initial download of the metrics may take a while.