Fig. 3
Download original image
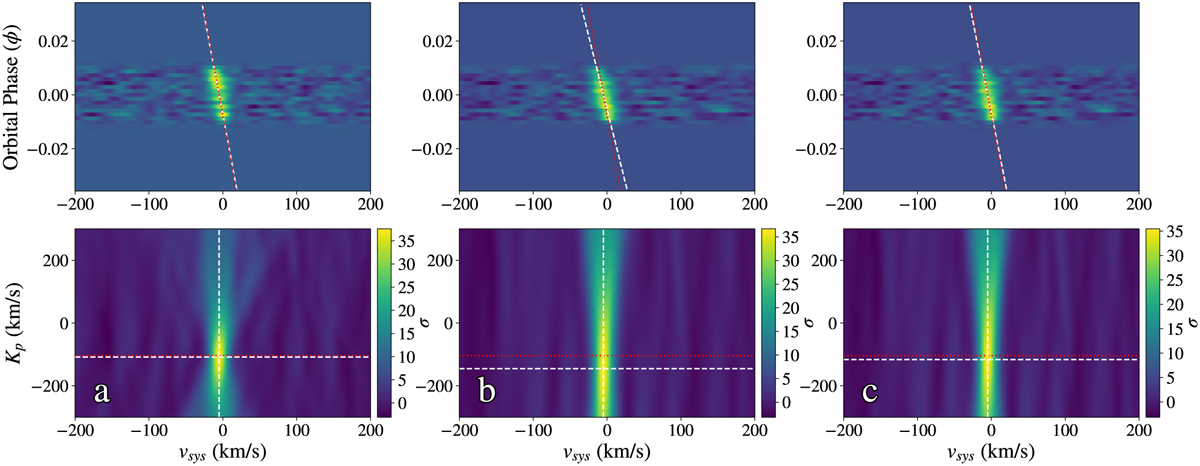
Cross-correlation and Kp–Δvsys maps for a planetary signal injected with P = 2 days injected into DS 1 (P2). Red dotted lines/curves show the injected velocity values, whereas white dashed lines/curves show the recovered values (i.e., the values at which there was a maximum in the CCF). (a) Data reduced using the SYSREM telluric removal method. Forward model also reprocessed using SYSREM filtering technique (Gibson et al. 2022). (b) Data reduced using the MOLECFIT telluric removal method. Forward model also reprocessed by division of mean out-of-transit spectrum (see panel (c)). If this step was omitted, we found an anomalous offset from the injected Kp value.
Current usage metrics show cumulative count of Article Views (full-text article views including HTML views, PDF and ePub downloads, according to the available data) and Abstracts Views on Vision4Press platform.
Data correspond to usage on the plateform after 2015. The current usage metrics is available 48-96 hours after online publication and is updated daily on week days.
Initial download of the metrics may take a while.