Fig. 2
Download original image
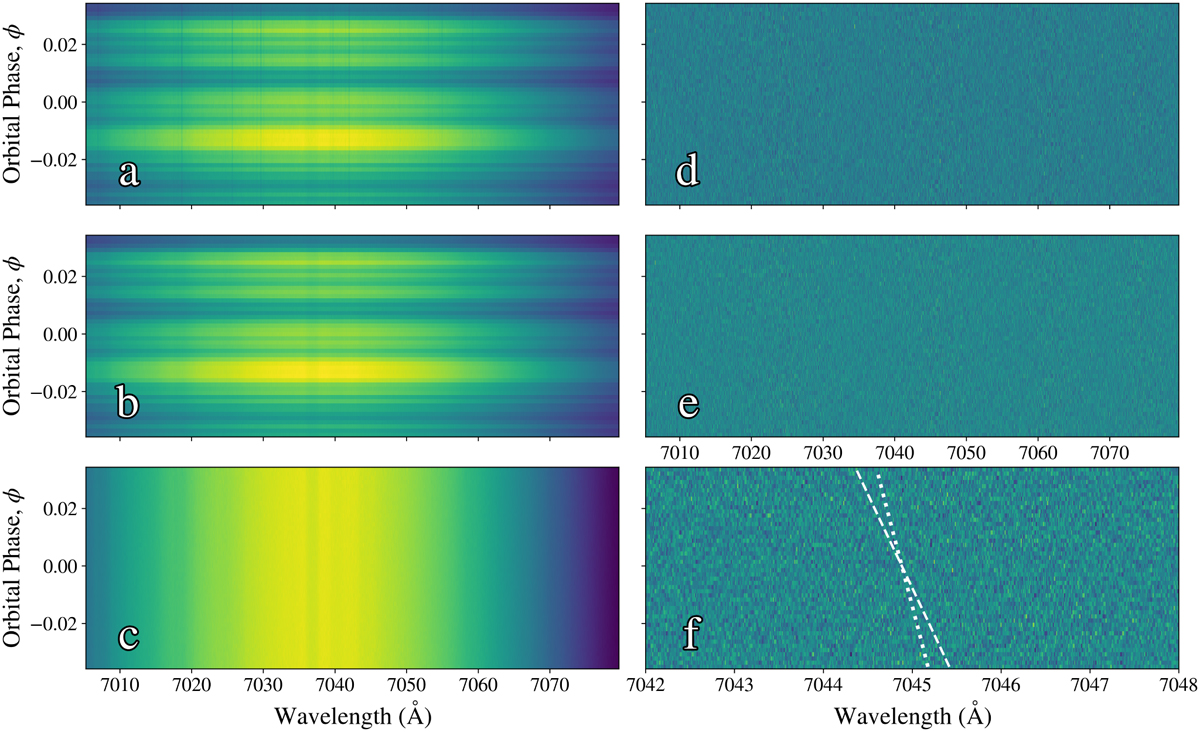
Various reduction steps applied for an individual ESPRESSO order of DS1. (a) Before telluric removal with MOLECFIT. (b) After telluric removal with MOLECFIT and shifted to the stellar rest frame. (c) Each spectrum is placed on a common blaze function (see Sect. 2.4). (d) Residuals after division through by the mean out-of-transit spectrum, weighted on their uncertainties. This panel shows the final data product used in the MOLECFIT preprocessing analysis. (e) Residuals after division through by the mean out-of-transit spectrum, weighted on their uncertainties, and subtraction of the SYSREM model. This panel shows the final data product used in the SYSREM preprocessing analysis. It is worth noting that for this procedure, we do not perform any preceding telluric removal (i.e., Sect. 2.4, Step (2)). (f) A magnification of panel (e) showing the wavelength shifts caused by each injected model. The planetary velocity curve for P2 is shown as a white dashed curve, whereas the slower moving planet’s (P12) velocity curve is shown as a white dotted curve.
Current usage metrics show cumulative count of Article Views (full-text article views including HTML views, PDF and ePub downloads, according to the available data) and Abstracts Views on Vision4Press platform.
Data correspond to usage on the plateform after 2015. The current usage metrics is available 48-96 hours after online publication and is updated daily on week days.
Initial download of the metrics may take a while.