Open Access
Fig. 1
Download original image
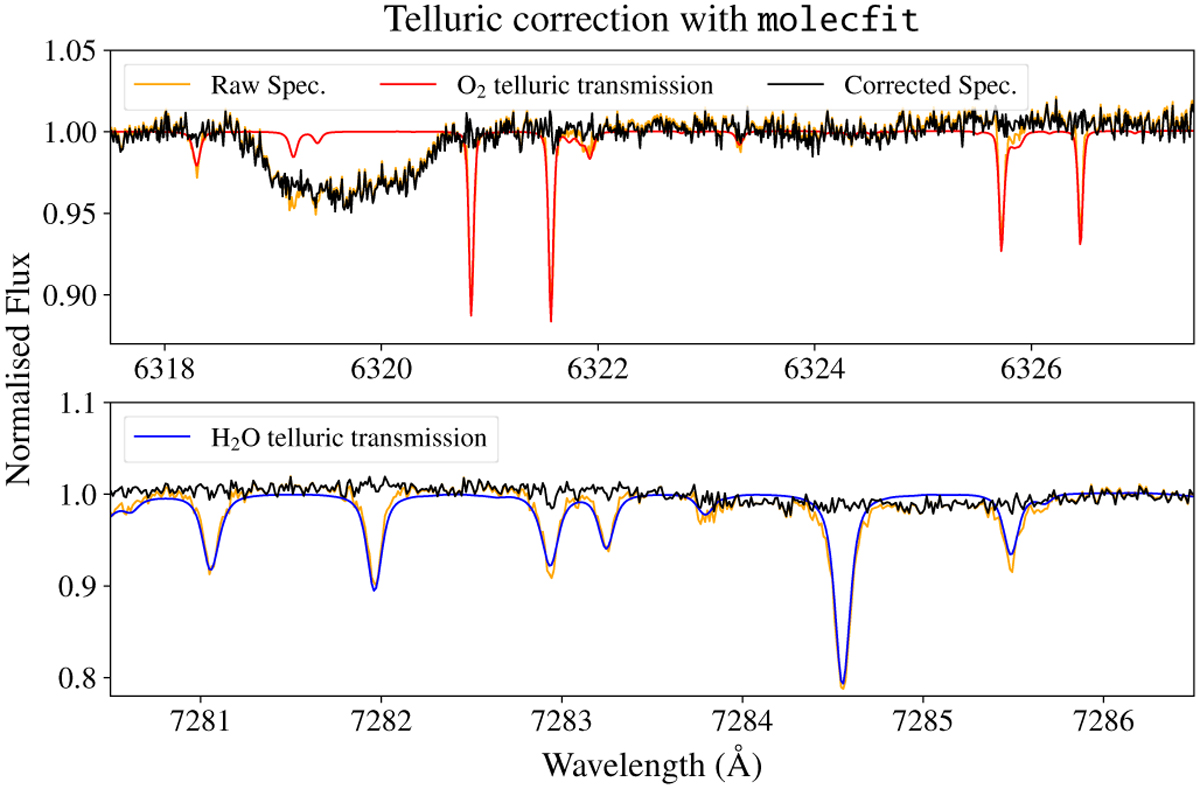
Example of telluric absorption correction with MOLECFIT on ESPRESSO S1D spectra. The top panel shows an O2 region, including a broad stellar absorption line. The bottom panel shows a H2O region. The final telluric model was used to correct the raw ESPRESSO S2D spectra (see Sect. 2.4)
Current usage metrics show cumulative count of Article Views (full-text article views including HTML views, PDF and ePub downloads, according to the available data) and Abstracts Views on Vision4Press platform.
Data correspond to usage on the plateform after 2015. The current usage metrics is available 48-96 hours after online publication and is updated daily on week days.
Initial download of the metrics may take a while.