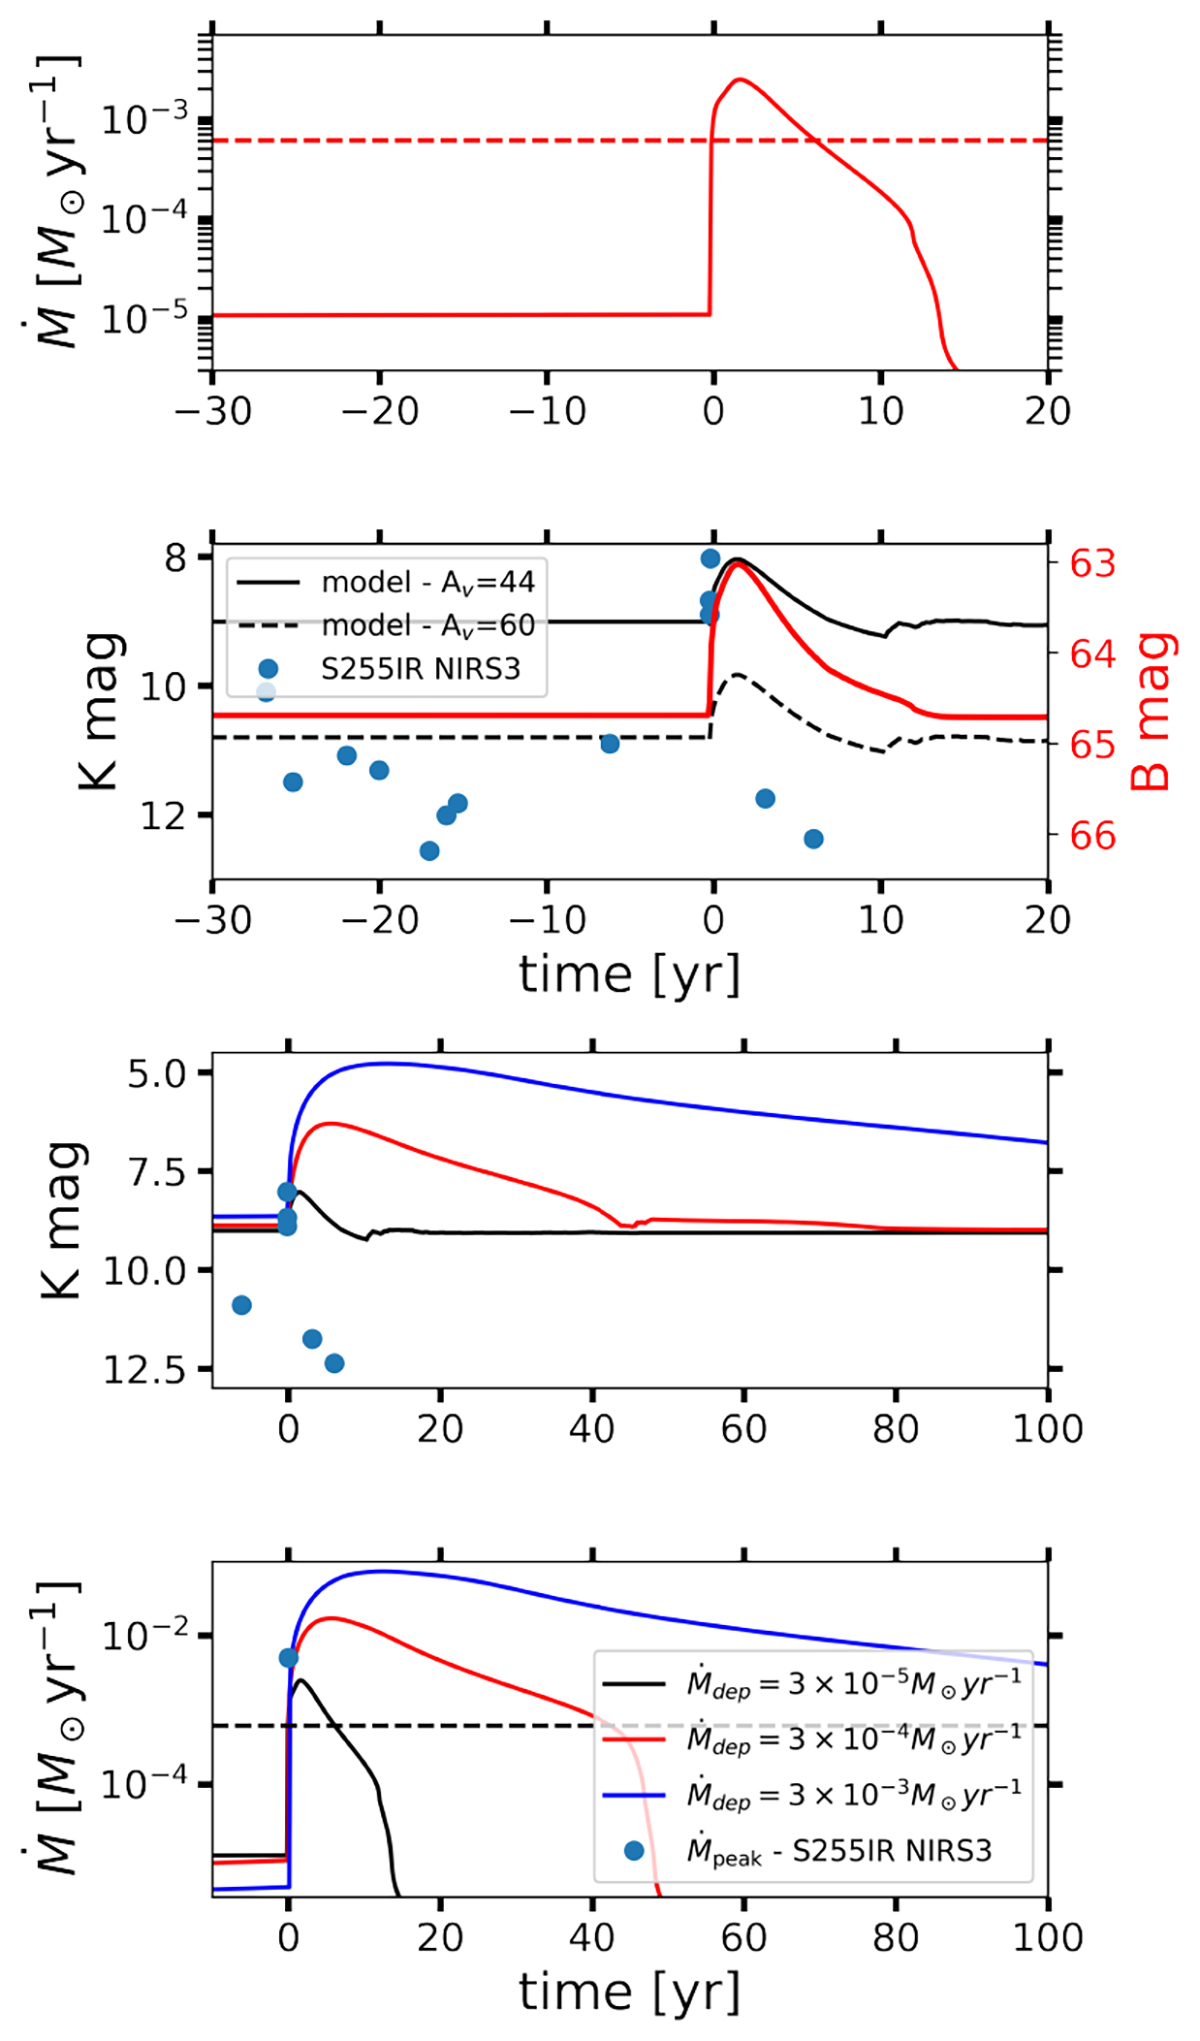
Fig. 7.
Download original image
Comparison of mass accretion rates, K-Band magnitudes, and observations during a TI outburst. Top panel: Mass accretion rate onto the star of mass M* = 20 M⊙ during a TI outburst. The horizontal dashed line shows the Ṁth value calculated with Eq. (8). Second panel: Model K-band magnitudes during the TI outbursts (solid black line) and the observed K-band photometry for the S255IR NIRS3 source from Fedriani et al. (2023) (blue dots). The K-band magnitudes for the model with the optical extinction Av = 60 is shown with the dashed black line. The red line corresponds to the model B-band magnitudes. The time t = 0 corresponds to the beginning of the model TI outburst and to the beginning of the observed outburst on S255IR NIRS3 registered in June 2015. Third panel: K-band magnitudes for the model presented in the top two panels of the figure (black line) and for two other models with the higher Ṁdep. The blue dots represent the observational data also shown in the second panel. Bottom panel: Mass accretion rate histories during the TI bursts in the models shown in the third panel with the corresponding colour. The horizontal dashed line marks the Ṁth value. The time t = 0 is similar to that in the top two panels. The blue dot marks the observed peak mass-accretion rate value on S255IR NIRS3 during the outburst.
Current usage metrics show cumulative count of Article Views (full-text article views including HTML views, PDF and ePub downloads, according to the available data) and Abstracts Views on Vision4Press platform.
Data correspond to usage on the plateform after 2015. The current usage metrics is available 48-96 hours after online publication and is updated daily on week days.
Initial download of the metrics may take a while.