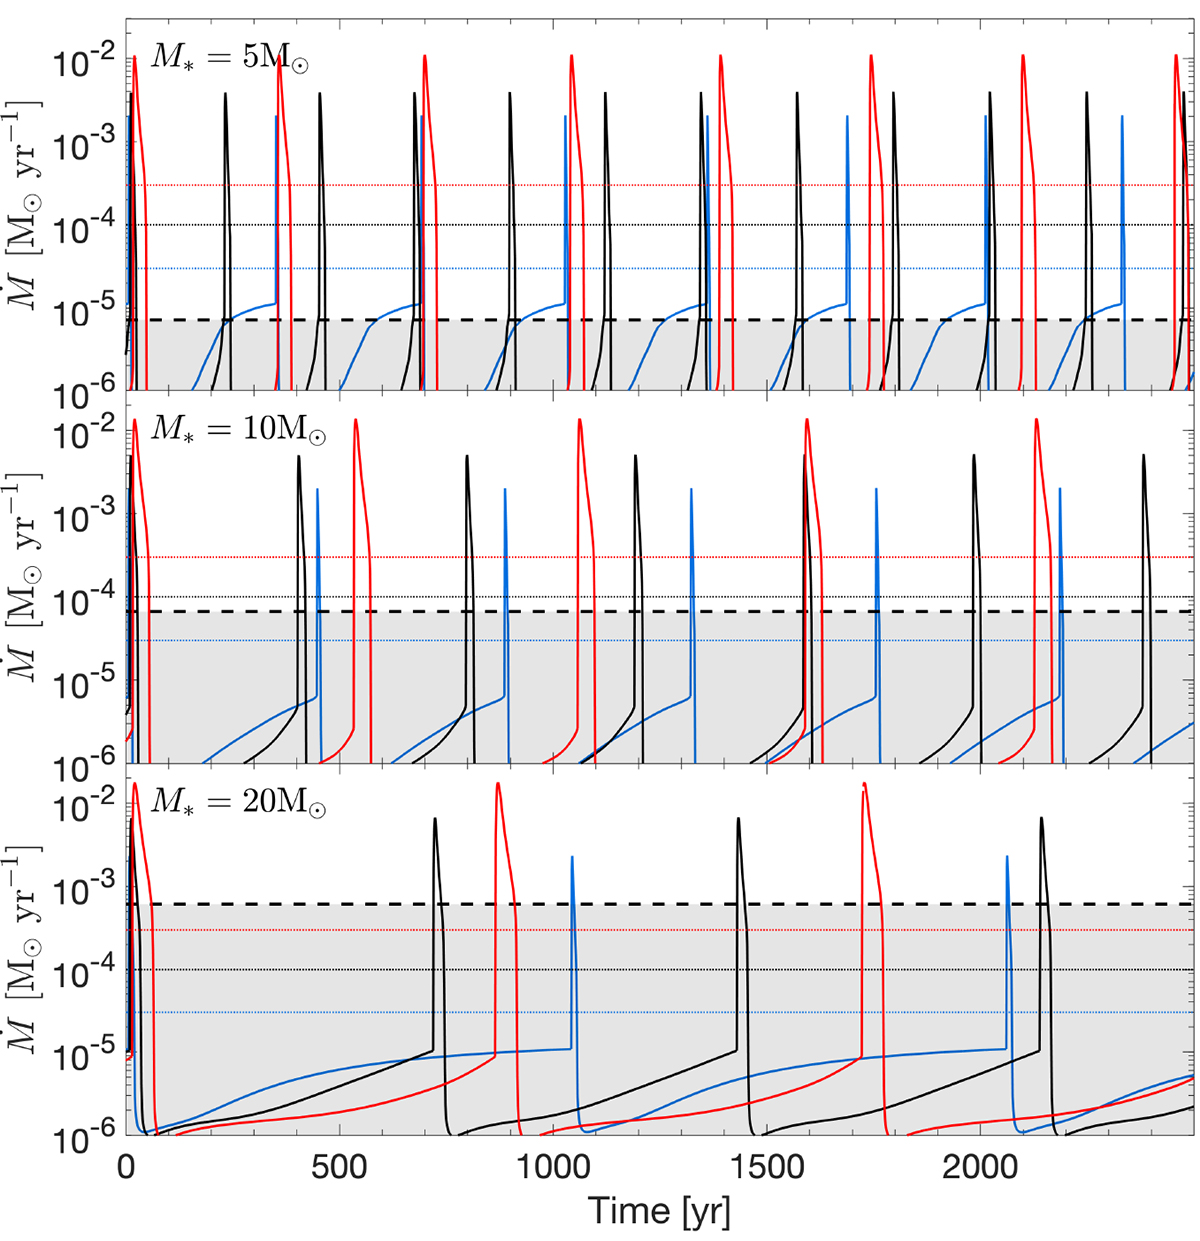
Fig. 2.
Download original image
Accretion rate onto the star of mass M* = 5 M⊙ (top panel), M* = 10 M⊙ (middle panel), and M* = 20 M⊙ (bottom panel) during TI bursts for three different values of Ṁdep–3 × 10⁻⁵ M⊙ yr−1 (blue line), 10−4 M⊙ yr−1 (black line), and 3 × 10⁻⁴ M⊙ yr−1 (red line). The horizontal black dashed line shows the Ṁth value for each stellar mass calculated with Eq. (8). The accretion rate variability below the dashed line (shaded region) is unlikely to be observable. The horizontal dotted lines show the Ṁdep for each model with the corresponding colour. The time instance t = 0 in all panels of the figure is arbitrary.
Current usage metrics show cumulative count of Article Views (full-text article views including HTML views, PDF and ePub downloads, according to the available data) and Abstracts Views on Vision4Press platform.
Data correspond to usage on the plateform after 2015. The current usage metrics is available 48-96 hours after online publication and is updated daily on week days.
Initial download of the metrics may take a while.