Fig. 1.
Download original image
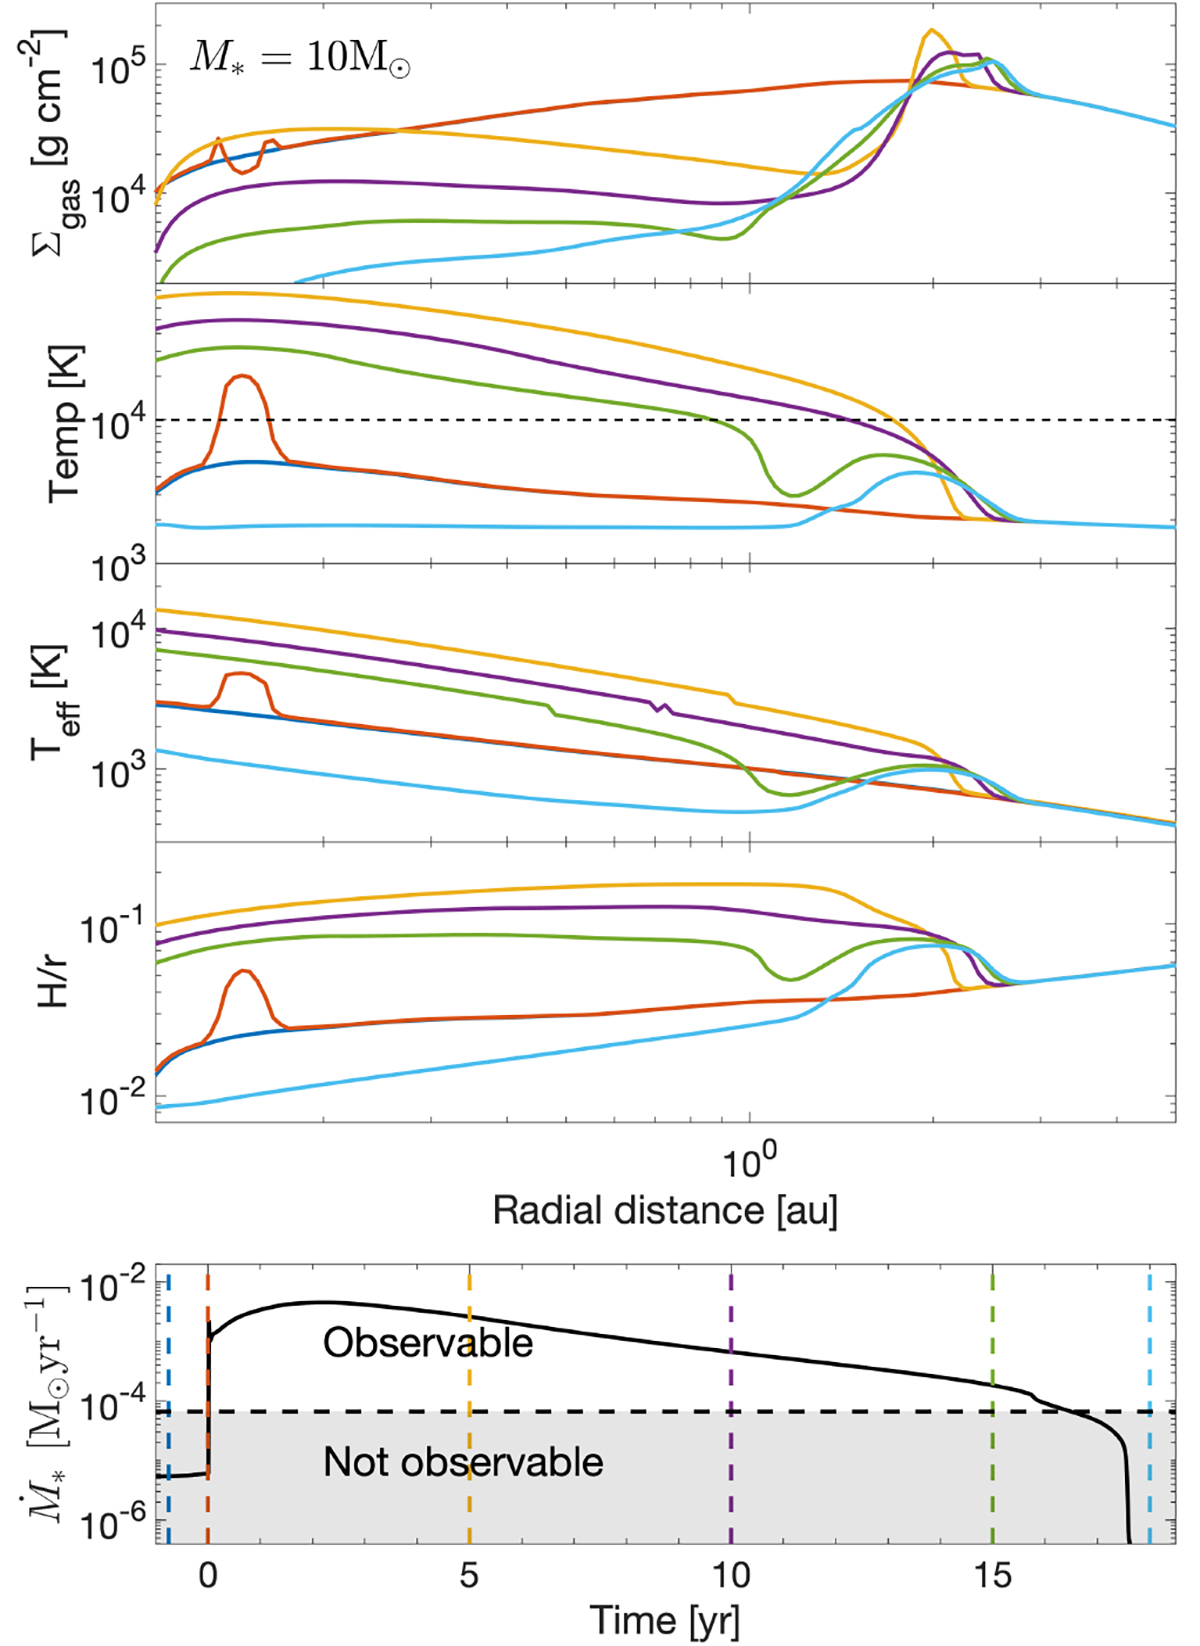
Evolution of disc properties and mass accretion rate during a thermal instability outburst. Top four panels: Radial profiles of gas surface density (top panel), midplane disc temperature (second panel), effective disc temperature (third panel), and disc aspect ratio (fourth panel) for five distinct time instances. Bottom panel: Mass accretion rate history onto the HMYSO during the TI outburst. The vertical dashed lines indicate the time instances for which the radial profiles with corresponding colours are shown in the top panels. The horizontal dashed line shows the value of Ṁth calculated with Eq. (8). The shaded area shows the non-observable part of the accretion rate variations.
Current usage metrics show cumulative count of Article Views (full-text article views including HTML views, PDF and ePub downloads, according to the available data) and Abstracts Views on Vision4Press platform.
Data correspond to usage on the plateform after 2015. The current usage metrics is available 48-96 hours after online publication and is updated daily on week days.
Initial download of the metrics may take a while.