| Issue |
A&A
Volume 692, December 2024
|
|
|---|---|---|
| Article Number | A24 | |
| Number of page(s) | 14 | |
| Section | Interstellar and circumstellar matter | |
| DOI | https://doi.org/10.1051/0004-6361/202451717 | |
| Published online | 29 November 2024 | |
An interferometric search for SiO maser emission in planetary nebulae
1
Instituto de Astrofísica de Andalucía, CSIC, Glorieta de la Astronomía s/n,
18008
Granada,
Spain
2
Center for General Education, Comprehensive Institute of Education, Kagoshima University,
1-21-30 Korimoto,
Kagoshima
890-0065,
Japan
3
Amanogawa Galaxy Astronomy Research Center, Graduate School of Science and Engineering, Kagoshima University,
1-21-30 Korimoto,
Kagoshima
890-0065,
Japan
4
European Southern Observatory,
Alonso de Cordova 3107, Casilla 19, Vitacura,
Santiago,
Chile
★ Corresponding author; rcala@iaa.es
Received:
30
July
2024
Accepted:
28
October
2024
Context. Maser emission of SiO, H2O, and OH is widespread in asymptotic giant branch (AGB) stars with oxygen- (O-) rich envelopes. This emission quickly disappears during the post-AGB phase and is extremely rare in planetary nebulae (PNe). So far, only eight PNe have been confirmed to show OH and/or H2O maser emission, and none have ever been found to show SiO maser emission.
Aims. We intend to obtain the first detection of a SiO maser from a PN. Such a detection would provide us with a useful tool to probe mass loss in PNe at a scales of a few AU from the central star, much shorter than the scales traced by H2O or OH masers.
Methods. We compiled two different samples. The first one comprises all known PNe with confirmed OH and/or H2O maser emission, as well as two candidate PNe showing OH masers. For the second sample, we compiled single-dish SiO maser detections in the literature, and compared them with catalogs of PNe and radio continuum emission (which could trace photoionized gas in PNe). We identified five targets (either PN or radio continuum sources) within the beam of the single-dish SiO maser observations. We then carried out interferometric observations of both samples with the Australia Telescope Compact Array, to confirm the spatial association between continuum and SiO maser emission.
Results. We find no SiO maser emission associated with any confirmed or candidate PN. In all targets, except IRAS 17390–3014, there is no spatial coincidence between SiO masers and radio continuum emission. While in IRAS 17390–3014 we cannot completely rule out a possible association, it is unlikely that the radio continuum emission arises from a PN.
Conclusions. The absence of SiO maser emission in PNe showing OH or H2O masers is of special interest, since thermal SiO emission has been reported in at least one of these targets, indicating that SiO molecules can be present in the gas phase. Since some maser-emitting PNe show evidence of having O-rich outer envelopes, and carbon- (C-) rich central stars and inner envelopes, we speculate that SiO abundance could be very low in the central regions where physical conditions are optimal for maser pumping, and C-bearing molecules may be dominant in the gas phase at those locations.
Key words: masers / stars: AGB and post-AGB / stars: winds, outflows / planetary nebulae: general / radio continuum: stars
© The Authors 2024
 Open Access article, published by EDP Sciences, under the terms of the Creative Commons Attribution License (https://creativecommons.org/licenses/by/4.0), which permits unrestricted use, distribution, and reproduction in any medium, provided the original work is properly cited.
This article is published in open access under the Subscribe to Open model. Subscribe to A&A to support open access publication.
1 Introduction
Circumstellar maser emission of the SiO, H2O, and OH molecules is widespread in asymptotic giant branch (AGB) stars with O-rich envelopes. These different species show a stratified distribution, with SiO masers located close to the star ≲10 au (Diamond et al. 1994; Desmurs et al. 2000; Reid & Menten 2007), and H2O and OH farther away (≃10–102 and 103−104 au, respectively; e.g., Bowers & Johnston 1994; Richards et al. 2012; Reid et al. 1977; Etoka & Diamond 2010), tracing a nearly spherical expansion of the envelope at different radii. This maser emission tends to disappear after the end of the AGB phase, when mass loss drops by several orders of magnitude, from rates up to ≃10−4 M⊙ y−1 in the AGB (Vassiliadis & Wood 1993; Blöcker 1995a) to 10−7−10−8 M⊙ yr−1 in the post-AGB phase (Vassiliadis & Wood 1994; Blöcker 1995b).
Considering the estimated timescale of disappearance of these maser species after the end of the AGB (10, 100, and 1000 yr for SiO, H2O, and OH, respectively; Gómez et al. 1990; Engels & Jiménez-Esteban 2007) and the duration of the transitional post-AGB phase (103−105 yr, Miller Bertolami 2016), no SiO nor H2O maser emission was expected when the planetary nebula (PN) phase begins (i.e., when the central star becomes hot enough, Teff ≃ 25 000 K, to photoionize its circumstellar environment), while only extremely young PNe (shortly after the onset of this photoionization) should show OH masers. This makes OH-maser emitting PNe (OHPNe, Zijlstra et al. 1989) very interesting objects to understand the early evolution of PNe. There are only six confirmed OHPNe (Uscanga et al. 2012; Qiao et al. 2016b), and several additional candidates (Cala et al. 2022).
Despite not being expected, five PNe are known to emit H2O masers (Miranda et al. 2001; de Gregorio-Monsalvo et al. 2004; Gómez et al. 2008; Uscanga et al. 2014; Gómez et al. 2015). The first identified case, K 3-35 (Miranda et al. 2001), actually emits both OH and H2O masers. Two other PNe, IRAS 17347–3139 (de Gregorio-Monsalvo et al. 2004; Tafoya et al. 2009) and IRAS 16333–4807 (Uscanga et al. 2014; Qiao et al. 2016b), also show emission of both species. The unexpected detection of H2O masers suggests that this emission in PNe is not the remnant of that seen in the AGB phase, which is related to isotropic winds, but it traces nonspherical mass-loss events instead (Suárez et al. 2007). In particular, interferometric observations usually show that OH and H2O maser emission in PNe is associated with equatorial ejections (expanding tori) and/or collimated jets (Miranda et al. 2001; Uscanga et al. 2014; Gómez et al. 2015; Qiao et al. 2016b). While these mass-loss phenomena allow the presence of maser emission in PNe for longer than previously expected, it is generally assumed that only extremely young PNe can be maser emitters, since the advance of the ionization front would eventually photodissociate OH and H2O molecules at the locations where those masers can be produced. The assumption of extreme youth of maser-emitting PNe is compatible with their scarcity.
Considering that new, nonspherical mass-loss events in the post-AGB and PN phases can provide the conditions of population inversion of OH and H2O levels (required for maser emission), it is reasonable to think that the same might happen in the case of SiO. In fact, a few late AGB and post-AGB stars are known to harbor SiO maser emission (e.g., Yoon et al. 2014; Nakashima & Deguchi 2003a; Amada et al. 2022), which is probably tracing either the base of collimated outflows (Imai et al. 2005) or circumstellar toroids (Sánchez Contreras et al. 2002). However, in the case of objects already in the PN phase, several attempts have been made to detect SiO masers, all with negative results (e.g., Bachiller et al. 1997; Nyman et al. 1998). In any case, SiO searches specifically targeting PNe remain scarce.
Obtaining a first detection of SiO masers in PNe would open a new window of research. It would allow us to probe mass loss at scales different from those traced by H2O and OH, probably closer to the central star. Moreover, we could characterize the physical conditions that favor the presence of SiO masers, and determine how this correlates with the presence of other maser species.
In this paper, we present the results of a new sensitive survey for SiO masers in confirmed and candidate PNe, carried out with the Australia Telescope Compact Array (ATCA). We selected two different samples, which are described in Sect. 2. We present our results in Sect. 4, which we subsequently discuss in Sect. 5
2 Source samples
2.1 Sample 1: Planetary nebulae with known OH and/or H2O masers
Planetary nebulae with either OH or H2O maser emission are considered to be at the beginning of this evolutionary phase. Thus, these nascent PNe are among the best targets to search for SiO maser emission as well, since we expect it to disappear shortly after the end of the AGB phase, at even shorter timescales than the OH or H2O masers. Our sample comprises 11 sources and includes all eight confirmed PN with OH or H2O maser emission, as well as two additional objects whose nature as PN has not been confirmed, presented in Cala et al. (2022): IRAS 16372–4808 and OH 341.6811+00.2634. We also included NGC 6302, a well known PN displaying OH line emission (Turner 1979; Zijlstra et al. 1989), although it has been suggested that this emission could be thermal, instead of maser (Gómez et al. 2016; Qiao et al. 2020). The list of sources is given in the first part of Table 1.
Some of these objects have already been observed in SiO transitions at 43 GHz (Jewell et al. 1991; Nyman et al. 1998), but with modest sensitivities (rms noise ≃1 Jy). The observations in this paper are significantly more sensitive (around two orders of magnitude).
2.2 Sample 2: Previous single-dish SiO maser detections near planetary nebulae and radio continuum sources
We carried out an extensive search in the literature and in publicly available catalogs for, on the one hand, reports on single-dish detections of SiO maser emission and, on the other hand, different catalogs of PNe and radio continuum emission, considering the latter as a possible tracer of free-free radiation from ionized gas in a PN (the list of references for the published works and catalogs we compiled would be too long to be detailed here, but some examples can be seen in references 21–30 in Table 1, and in the description of each source below). We then cross-matched these single-dish SiO detections with PNe and radio continuum sources, which resulted in five candidate sources (Table 1, bottom five sources) within the beam of the single-dish SiO observations. A definite confirmation of the association of maser emission with known PNe or with radio continuum emission requires interferometric confirmation, to ascertain that the SiO maser emission actually arises from the target object, and not from a different source within the single-dish beam.
3 Observations and data processing
ATCA observations were carried out in two sessions. The sample described in Sect. 2.1 (Sample 1, project C3324, PI: R. A. Cala) was observed on 2019 October 21, with the H168 configuration of ATCA (minimum and maximum baselines of 61 and 192 m, respectively, when discarding antenna CA06) and the sample in Sect. 2.2 (Sample 2, project C3391, PI: R. A. Cala) on 2020 October 16 with the 6B configuration (baselines between 214 and 5969 m). In both sessions, we observed at two different intermediate frequencies (IFs), centered at 43 and 45 GHz, obtaining full linear polarization products with a bandwidth of 2 GHz each. We used the CFB 64M-32k mode of the Compact Array Broadband Backend (CABB) of ATCA, which samples each 2-GHz bandwidth into broadband channels with a width of 64 MHz, used for continuum observations. The CABB internally oversamples the total bandwidth, by obtaining broadband channels with separation of half the channel width, but only half of them (with final channel separation equal to the channel width) are provided to the user for the continuum dataset (a total of 32 channels of 64 MHz for the CFB 64M-32k mode). Five of the internal broadband channels were independently zoomed in with a finer spectral resolution, to obtain five individual spectral windows, each including one SiO transition and sampled into 2048 channels of 32 kHz width (velocity resolution 0.22 km s−1). Of these channels, only the central 1847 ones were kept, providing a total coverage of ≃404 km s−1. An additional set of 5 adjacent internal broadband channels was combined and also zoomed in, providing a spectral window with 6144 channels, of which the central 5943 ones were kept (velocity resolution and coverage of 0.22 and 1296 km s−1, respectively). This last set of channels includes both the hydrogen recombination line H53α (rest frequency = 42 951.968 MHz), and the 29Si16O (v = 0, J=1–0) line. Therefore, in total we observed six SiO transitions: four of the main isotopologue, 28Si16O (hereafter 28SiO), and two of 29Si16O (hereafter 29SiO). These transitions are listed in Table 2.
In both sessions, the bandpass calibrator was 3C 279 (PKS 1253−055), while the absolute flux calibrator was PKS 1934−638. Further information on our observational parameters, including the complex-gain calibrator for each target, is listed in Table 1. We note that the observations of project C3324 (sample 1) were carried out in the H168 configuration, in which five of the ATCA antennas have a relatively compact distribution, with maximum baseline of 192 m, and there is a sixth antenna (CA06) at a fixed position, ≃4.5 km away from the main array. Although we included CA06 in our initial maps, the quality of the resulting maps was poor, given the highly inhomogeneous sampling of the uv-plane. Therefore, we excluded antenna CA06 from the data we presented for this project C3324. However, for project C3391 (sample 2) we used the whole array of six antennas, which gave good-quality maps, since the antenna distribution was optimized for observations at high angular resolution.
Data were calibrated with the Miriad software (Sault et al. 1995), following standard procedures for millimeter data processing in the ATCA users’ guide. We then further processed the calibrated data using both the Common Astronomy Software Applications (CASA, CASA Team 2022) and the Astronomical Image Processing System (AIPS, Fomalont 1981). We used CASA for initial data inspection, creating images and data cubes with task tclean. With this, we could identify the sources where line and continuum emission were detected. We also attempted self-calibration of the data with CASA, but its performance proved to be somewhat worse than AIPS self-calibration, at least for our data, using equivalent parameters. As an example, the signal-to-noise improvement of AIPS vs. CASA was a factor of 2 when self-calibration was carried out with continuum data (sample 1), and a factor of ≃1.5 when using masers (sample 2). Even though this improvement may seem modest, it could be important for a detection project like ours, in case the emission is close the sensitivity limit. Therefore, we decided to continue all further data processing using AIPS. Tasks mentioned below correspond to the AIPS package, unless stated otherwise.
Since the ATCA does not correct the frequency drift due to the Earth’s motion during the observing session, we carried out an off-line correction of the visibilities of the line spectral windows for this Doppler shift, using task CVEL, to align all data to the same velocity (with respect to the kinematical definition of the Local Standard of Rest, hereafter LSR). All radial velocities mentioned in this paper are given with respect to the LSR. In the fields where obvious SiO emission was detected (most sources in sample 2), we selected the velocity channel with strongest emission of the 28SiO v=1 line, and carried out phase and amplitude self-calibration. In most cases we could obtain solutions at intervals as short as the integration cycle time of the individual visibilities (6 seconds for sample 1, 10 seconds for sample 2). We then copied the solutions to the whole dataset, including all spectral lines and the continuum emission. For sample 1, where no SiO emission was detected, we carried out self-calibration on the radio continuum data at 43 GHz, and the solutions were then copied to the spectral line data and the continuum at 45 GHz. By using the same self-calibration solutions for all data in each source, we ensure a better relative accuracy in the flux density measurements.
Moreover, for sample 1, the sampling of the interferometric plane provided by the ATCA with the short time span covered by the observations of each source (≃45 min in most cases) is poor, which results in point spread functions with strong sidelobes. In the case of the unresolved sources with a good signal-to-noise ratio, this is not a major problem, since the CLEAN algorithm can work properly and remove the sidelobes. However, the continuum emission in NGC 6302 is resolved, which significantly affects the image reconstruction. In fact, several of the resulting sidelobes of the maps are actually stronger than the peak closest to the expected location of the source. Even restricting deconvolution to this central peak, we could not obtain continuum maps with good enough fidelity to provide reliable source parameters. The interferometric visibilities, however, clearly show the presence of emission. Thus, the parameters of the continuum emission in this source, presented below, were obtained by fitting an elliptical Gaussian function to the visibilities using task uvmodelfit of CASA.
We subtracted the continuum emission from the visibilities of the spectral lines using task UVLIN, by selecting channels without line emission in the spectral window of each transition. For the continuum emission, we used the broadband channels covering 2 GHz at each IF, flagging out the frequencies were the line emission was detected. Final maps were obtained with task IMAGR, using Brigg’s weighting of visibilities, with robust parameter equal 0 (which is equivalent to 0.5 in the imaging tasks of CASA, such as tclean). The continuum images were obtained with multi-frequency synthesis. All continuum and line images were deconvolved using the CLEAN algorithm (Clark 1980), implemented in task IMAGR.
The absolute astrometric accuracy of the ATCA has been estimated to be ≃0.4″ for well-calibrated data and under good weather conditions (e.g., Caswell 1997; Ellingsen et al. 2018). Since we self-calibrated our data and the weather conditions were acceptable but not excellent, our astrometric accuracy is then determined by the positional accuracy of our model for each source (the position of the radio continuum emission at 43 GHz for sample 1 or the peak of the 28SiO (v=1, J=1–0) emission in sample 2). A comparison of the position in final images of the features used for self-calibration, with that of their counterpart sources in the Gaia DR3 catalog (Gaia Collaboration 2016, 2023), 2MASS point source catalog (Skrutskie et al. 2006), and Spitzer catalogs (Spitzer Science 2009) allows us to estimate that our absolute astrometry is accurate to <1.2″ for sample 1, and <0.7″ for sample 2. Positional information in our data was obtained by fitting elliptical Gaussians to the emission, with task JMFIT. The positions we report in the results of this paper correspond to the emission used as a self-calibration reference. Therefore, for sources detected in continuum emission, we provide the absolute positions at 43 GHz. In the case of sources with detected maser emission, considering the angular resolution of the observations and the signal-to-noise ratio achieved, the different maser components of all SiO transitions within each source were compatible, within the errors, so we cannot provide information about the spatial distribution of the emission. Therefore, for these maser detections, we only give the estimated position of the strongest maser component for the 28SiO (v = 1, J=1–0) transition as representative of all SiO maser emission, in the results presented in Sect. 4.2.
The uncertainty of flux calibration in ATCA observations at 7 mm is estimated to be ≃10%. However, we note that we do not include this uncertainty when quoting flux density errors in the tables of this paper. The flux density errors in this paper only consider the contribution of thermal noise in the maps, and are given at a 1σ level. These errors provide a good representation of the relative flux uncertainties among the different SiO transitions, and between these and the continuum emission, since they all share the same flux and complex gain calibration, and observations are simultaneous. The errors we quote are thus useful for estimating line ratios and their uncertainties in our data. However, the 10% uncertainty in absolute calibration should be added to the flux density errors quoted in this paper, when comparing with the emission from other datasets. We also note that the errors quoted in this paper for all parameters are given at a 1σ level, while upper limits are at 3σ.
Parameters of our ATCA observations.
Observed SiO transitions.
4 Results
We have not detected any SiO maser emission associated with PNe or PN candidates, in either observed sample. In particular, in the young PNe of sample 1 we detected radio continuum emission but no SiO. In sample 2, we detected SiO emission that corresponds that previously reported in single-dish observations toward these objects, but we could not confirm any association of SiO and radio continuum emission. Instead, our interferometric observations allow us to firmly establish the association of the detected SiO emission with strong, point-like infrared sources. Together with the absence of radio continuum emission, we infer that these SiO-emitting sources are most likely AGB or post-AGB stars.
4.1 Sample 1
In the case of the sample of confirmed and candidate PNe that emit maser emission of other molecular species (OH and/or H2O), we do not detect any SiO emission within the observed fields. We detect the continuum emission associated with all the targets in this sample. A summary of the results is presented in Table 3. The continuum emission of all sources, except NGC 6302, is unresolved in our images (with an angular resolution ≃6″). As mentioned in Sect. 3, the position and flux densities reported in Table 3 for NGC 6302 were obtained by fitting a model of an elliptical Gaussian source to the visibilities. The full width at half maximum of the fitted Gaussian was 11″ × 9″, with position angle ≃−53°.
We note that values of the radio continuum emission at 43 and 45 GHz using this dataset were already presented for IRAS 16372–4808 and OH 341.6811+00.2634 by Cala et al. (2022). Here we present slightly revised values for these sources. The main difference with respect to Cala et al. (2022) is that, in that paper, the data at each frequency were self-calibrated independently, while in the present paper we used the same self-calibration solutions (those obtained at 43 GHz), as mentioned in Sect. 3. The new values are compatible with the previously reported ones.
We also detected the H53α recombination line in seven of the targets of this sample. These results will be presented in a forthcoming paper.
Radio continuum emission and representative SiO upper limits in confirmed and candidate PNe with OH and/or H2O masers (sample 1).
4.2 Sample 2
SiO maser emission was detected in most of the observed fields (Table 4). SiO maser emission had been previously reported in those sources via single-dish observations, but we provide accurate interferometric positions, for the first time in most cases. Based on this, in no case we could confirm that it was associated with a PN. In particular, the position of the SiO emission we obtain in our interferometric maps does not match any of the radio continuum sources reported in their neighborhood or, in some cases, the reported continuum sources may be spurious. Only in the case of IRAS 17390–3014, there is an extended radio continuum source that overlaps the optical/infrared position of the SiO-emitting object. However, as discussed in 4.2.1, we think it unlikely that the radio continuum source corresponds to a planetary nebula. Moreover, the large offsets found in some sources between SiO and the previously reported radio continuum emission cannot be due to proper motions, since these are lower than 7 mas in all cases, according to Gaia data. We present below the results for each individual source, discussing the relative position of the SiO emission with respect to radio, infrared, and optical sources that could be potential hosts of these masers.
4.2.1 IRAS 17239–2812
Emission from the 28SiO transitions v = 1, 2, J=1–0 was detected by Hall et al. (1990) in single-dish observations toward the position listed in the IRAS point source catalog, using the Parkes Radio Telescope, with angular resolution of 1.6 arcmin, and peak flux densities 25 and 37 Jy for the v = 1 and v = 2 lines, respectively. More recent interferometric observations with the Very Large Array (VLA) (Dike et al. 2021) detected emission of the 28SiO v = 0, J=1–0 transition. Emission from this transition can have both thermal and maser origin, although Dike et al. (2021) conclude that, in this source, it is mostly of maser nature. No explicit coordinates for the emission is given by these authors, although their identification with a 2MASS source is consistent with ours.
IRAS 17239–2812 can be associated with the infrared source 2MASS J17270541–2815299 and the optical object Gaia DR3 4059869891553026048, which provide a more accurate position. It has infrared colors compatible with those of AGB stars, and its OH spectrum shows the typical double-peak profile of this type of objects (Sivagnanam et al. 1990). There are several reports of radio continuum emission, with catalog positions within the beam of the single-dish SiO observations, such as TXS 1723–282 (Douglas et al. 1996) at 365 MHz, MGPS J172702–281511 (Murphy et al. 2007) at 843 MHz, or NVSS J172702–281525 (Condon et al. 1998) at 1.4 GHz. The formal position in the TXS catalog is only ≃6″ away from the optical/infrared counterpart of IRAS 17239–2812, a distance which is close to the positional uncertainty quoted for TXS 1723–282 (4″ in right ascension and 1.6″ in declination). However, the positions of the sources reported in the MGPS and NVSS catalogs are significantly offset from the optical/infrared one, considering that their positional errors are better than ≃1″ − 2″ (e.g., NVSS J172702–281525 is 34″ away from Gaia DR3 4059869891553026048 but the position error reported for the radio source is ≃0.09″ × 1.3″).
We detected several transitions of SiO. Spectra are shown in Fig. 1. In Fig. 2 we compare the location of the SiO maser emission with respect to some of the optical, infrared, and radio sources mentioned above. Our interferometric observations clearly show that the SiO emission is associated with IRAS 17239–2812, but we found no radio continuum emission, with 3σ upper limits of 90 and 130 μJy beam−1 at 43 and 45 GHz, respectively. Moreover, the position of the SiO masers is not compatible with the radio continuum sources NVSS J172702–281525 nor MGPS J172702–281511. We also checked the radio continuum images at 2.1 GHz from the ATCA followup of the SPLASH survey (Qiao et al. 2016a), processed by Cala et al. (2022), and there is extended emission associated with NVSS J172702–281525, but no detection at the optical/infrared position of IRAS 17239–2812. It is also likely that the position listed for TXS 1723–282 has a larger error than the one reported in that catalog, and that the emission found in the TXS, MGPS, and NVSS catalogs actually corresponds to the same object. The possibility of such large positional errors in the TXS catalog is further discussed in Douglas et al. (1996). In any case, at this point we have no evidence that IRAS 17239–2812 is associated with any radio continuum emission.
SiO(J=1–0) emission for sources of sample 2.
4.2.2 IRAS 17390–3014
28SiO maser emission has been previously detected with the Nobeyama 45-m radio telescope by Deguchi et al. (2004) and Fujii et al. (2006). The reported values of peak flux density for the J=1–0, v = 1 and v = 2 lines are similar in both works. For instance, Deguchi et al. (2004) obtain a peak flux density of ≃1.4 Jy for both transitions, while Fujii et al. (2006) get ≃1.3 Jy.
IRAS 17390–3014 is associated with the near-IR source 2MASS J17421887–3015288 and the optical one Gaia DR3 4056748416698878592. The OH maser spectrum shows a double-peaked profile typical of AGB stars (Sevenster et al. 1997a; Qiao et al. 2018), with a separation between the peaks of ≃23 km s−1, and a central LSR velocity of ≃−22 km s−1. There is a radio continuum source at 1.4 GHz, NVSS J174218–301526 (Condon et al. 1998), with a flux density of 10.2 ± 1.4 mJy and a catalog position only ≃ 6″ away from that of the 2MASS and Gaia sources. Moreover, this radio source was reported to be extended, with estimated deconvolved major and minor axes (full width at half maximum) of 66.2″ ± 12″ and <46.8″, respectively, with position angle 6° ± 9°. Since the identification and parametrization of sources in the NVSS catalog (Condon et al. 1998) were carried out with an automated algorithm, applied on relatively large fields (size 4° × 4°), we downloaded the NVSS image to check the accuracy of the reported position and size estimates for the radio source. We fitted a Gaussian with the image viewer of CASA, using a box that only contained NVSS J174218–301526, and obtained deconvolved major and minor axes of 80″ ± 12″ and 34″ ± 8″ (position angle −5° ± 6°), respectively, which are compatible with the values listed in the NVSS catalog. We will assume our size estimates in our calculations below. The extended and elongated radio source contains the infrared/optical position of IRAS 17390–3014 so, in principle, it could be associated with this source, tracing, for instance a bipolar ionized nebula, as in many PNe. Moreover, both the infrared/optical and the radio positions are within the beam of the single-dish SiO observations, which makes IRAS 17390–3014 a tantalizing candidate for an SiO-maser-emitting PN.
Ours are the first reported interferometer observations of SiO masers in this region. The SiO spectra are shown in Fig. A.1. In Fig. 3 we plot the relative positions of the SiO maser emission on an infrared image, where we have marked some of the sources mentioned in this section. No radio continuum emission has been detected in our data, with 3σ upper limits of 90 and 80 μJy beam−1 at 43 and 45 GHz, respectively. In order to properly compare our limit with the detected radio source at 1.4 GHz (NVSS J174218–301526), we have to consider that the flux density is expected to increase, and the size of the emission to decrease at higher frequencies, in the case of nascent PNe. In quantitative terms, if the radio source were tracing the free-free emission in a nascent PN, whose photoionized region is expected to have a radial dependency of particle density as n ∝ r−2, the flux density and linear size of the emission would vary with frequency as Sν ∝ ν0.6 and θν ∝ ν−0.7, respectively. These dependencies are valid both for a spherical ionized region (Panagia & Felli 1975) and for a biconical, jet-like distribution with the same radial dependency of density (Reynolds 1986). Therefore a source of 10.2 mJy at 1.4 GHz would emit ≃80 mJy at 43 GHz. Regarding its size, assuming an ellipsoidal ionized region with a size dependence of θν ∝ ν−0.7 in all directions or a biconical distribution with that dependence along the major axis while maintaining the opening angle (Anglada et al. 2018), its size would shrink from 80″ × 34″ to ≃7″ × 3″. This translates to an expected mean intensity of ≃0.5 mJy beam−1 at 43 GHz in our observations, which is well above the detection threshold of our continuum data (it should have been detected with a signal-to-noise ratio ≳15). Therefore, our non-detection in continuum at 43–45 GHz indicates that the continuum source cannot be tracing an ionized region with a radial dependence of n ∝ r−2, strongly suggesting that it is not associated with a nascent PN. However, the continuum source could be tracing a more evolved PNe, with an optically thin emission (α ≃ −0.1) at least in part of the radio spectrum, and/or with a large size at 43–45 GHz, comparable with that at 1.4 GHz.
To further consider the possibility that the radio emission is tracing a bipolar PN, physically associated with IRAS 17390–3014, we checked publicly available optical and infrared images at different wavelengths. In the images where IRAS 17390–3014 is detected, it shows up as a point source, with no hint of the extended nebulosity that could be expected if the radio continuum emission traces the ionized region of a PN. Therefore, we suggest that the radio continuum emission is not associated with IRAS 17390–3014, but it could be the superposition of several background sources within the 45″ beam of the NVSS images. It is, however, important to obtain sensitive radio continuum images with a resolution better than those ≃45″, to find out the sources that may be associated with that type of emission, and to definitely ascertain whether or not some radio continuum emission could be actually related to IRAS 17390–3014. We checked the National Radio Astronomy Observatory Data Archive and the Australia Telescope Observational Archive, to search for publicly available VLA and ATCA observations, but we could not find any data with enough sensitivity for this goal.
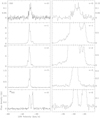 |
Fig. 1 SiO (J=1–0) spectra of IRAS 17239–2812. The spectra on the right column are the same as those in the left one (no spectral smoothing applied), but zooming in on the x and/or y axes, to better show the weakest components. The spectra of the other objects presented in this paper are shown in Appendix A. |
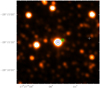 |
Fig. 2 K-band infrared image from the 2MASS survey, centered at IRAS 17239–2812. The white cross marks the location of the radio source NVSS J172702–281525, the black cross is at the position of the SiO maser emission in our data, and the green square is at the catalog position of TXS 1723–282. The blue circle is centered at the optical source Gaia DR3 4059869891553026048. Coordinates are in the equatorial (equinox J2000) system. |
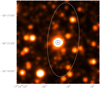 |
Fig. 3 K-band infrared image from the 2 MASS survey, centered at IRAS 17390–3014. The white cross marks the center of the Gaussian fit to the radio source NVSS J174218–301526, while the white ellipse represents the full width at half maximum size of this fit. The black cross is at the position of the SiO maser emission in our data. The blue circle is centered at the optical source Gaia DR3 4056748416698878592. Coordinates are in the equatorial (equinox J2000) system. |
4.2.3 H 2–18 and IRAS 17403–2107
Our observations were centered at the radio position of the PN H 2–18 (Table 1), reported by Gathier et al. (1983), with a positional accuracy of ≃0.2″. This radio source has a deconvolved size of 1.8″ ± 0.6″ and a flux density of 11 mJy at 4.9 GHz. H 2–18 was first cataloged as a possible PN by Haro (1952), and confirmed thereafter (e.g., Acker et al. 1991, 1992). It has a bipolar morphology in the optical, with a size of ≃1.9″ (Guerrero et al. 2013). Its inclusion in our sample was based on a previous incorrect association of H 2–18 with IRAS 17403–2107 in the SIMBAD database when we built our target list, while these two sources are actually 2.6 arcmin apart. This error was solved in SIMBAD at the time of submission of this paper. There are several single-dish SiO maser detections toward IRAS 17403–2107 (Izumiura et al. 1995; Deguchi et al. 2007), but no report of radio continuum emission. IRAS 17403–2107 is actually outside the primary beam of our interferometric observations. This source has been classified as a Mira variable (Iwanek et al. 2022).
Even though H 2–18 does not really fulfill our criteria for being included in sample 2 (Sect. 2.2) due to this incorrect previous association, we still think that reporting our results on this source is of interest in the context of searching for SiO emission in PNe. In our data, we did not detect any SiO emission associated with the PN H 2–18.
For further evidence of the distinction between H2–18 and IRAS 17403–2107, we point out that the counterparts of IRAS 17403–2107 at optical and near infrared wavelengths are Gaia DR3 4117388024866473088 and 2MASS J17431835–2109031, respectively, whereas H 2–18 is most likely associated with Gaia DR3 4117385040014126592 and 2MASS 17432875–2109515, instead.
4.2.4 IRAS 18052–2016 (OH 10.04–0.10)
Emission of different transitions of 28SiO has been reported via single-dish observations, including the v = 1, J=2–1 transition at 86 GHz (Deacon et al. 2007), v = 1 and v = 2, J=1–0 at 43 GHz (Yoon et al. 2014). Maser emission of other molecular species, such as OH (e.g., Baud et al. 1979a; Sevenster et al. 1997a) and H2O (Engels et al. 1986; Yoon et al. 2014), has also been found.
IRAS 18052–2016 is associated with the near-IR source 2MASS J18081638–2016115. There is no associated optical source in the Gaia DR3 catalog. Radio continuum emission has been reported in this source by Garwood et al. (1988) and Zoonematkermani et al. (1990), from simultaneous observations at 1441.5 and 1611.7 MHz with the VLA, with a flux density of 26 mJy in the combined dataset (central frequency = 1526.6 MHz). However, Becker et al. (1992) pointed out that the detected emission could actually be due to contamination from the OH maser, since it is only present in the band at 1611.7 MHz. The bandpass of the VLA continuum data before 2010 was not sampled in frequency, which would have helped to identify the presence of spectral lines within the band. Later observations by Bains et al. (2009) did not provide any detection of radio continuum emission, with reported 1σ noise values of 0.57 mJy beam−1 at 4800 MHz (beam = 6.8″ × 2.6″) and 0.11 mJy−1 beam−1 at 8640 MHz (beam = 3.7″ × 1.4″). In our data, we obtain a 3σ upper limit of 110 μJy−1 beam−1 at both 43 and 45 GHz. We thus must conclude that there is no significant amount of ionized gas associated with this source. IRAS 18052–2016 could be a post-AGB star, based on the OH maser spectrum with four components (Qiao et al. 2020), which departs from the usual double-peaked one in AGB objects, and on its infrared colors (Deacon et al. 2004).
In Fig. A.2, we show the SiO spectra we detected toward this source. We note that the apparent absorption features around 55–60 km s−1 in the 28SiO v = 0 spectrum smoothed to 0.88 km s−1 must be an artifact, since there is no background continuum emission against which line absorption can be produced.
4.2.5 IRAS 19508+2659 (OH 63.9–0.2)
Single-dish detections of 28SiO maser emission have been reported in this source by Nakashima & Deguchi (2003a) and Cho et al. (2017). The first single-dish report on OH maser was provided by Baud et al. (1979b), and interferometric confirmation has been subsequently obtained (THOR survey, Beuther et al. 2019). The OH spectrum shows the typical double-peaked profile of AGB stars. H2O maser emission is also detected in this source (Lewis & Engels 1988; Engels & Lewis 1996).
IRAS 19508+2659 is associated with sources 2MASS J19525786+2707447 and Gaia DR3 2027177220301507072. Radio continuum emission was reported by Garwood et al (1988) and Zoonematkermani et al. (1990) at 20 cm (mean frequency of 1526.6 MHz), with a flux density of ≃13 mJy. However, note that this catalog has the problem (mentioned in Sect. 4.2.4 for IRAS 18052–2016) that one of the two band-passes, centered at 1611.7 MHz and with a bandwidth of 3.125 MHz, includes the frequency of the OH maser line at 1612 MHz so several sources in these catalogs were not really continuum sources, but were contaminated by OH maser emission. Becker et al. (1992) compiled a list of sources in those data that showed emission at 1611.7 MHz but not at 1441.5 MHz and therefore, they were likely to be OH maser sources. IRAS 19508+2659 was not included in this list of OH maser sources. Using the same data presented by Garwood et al. (1988) and Zoonematkermani et al. (1990), White et al. (2005) reported a value of continuum emission at 20 cm of 8.45 ± 1.48 mJy, at a position R.A.(J2000) = 19h52m57.90s (error = 0.7″), Dec(J2000) = +27°07′44.7″ (error = 0.8″), and with a deconvolved major axis ≃2.34″. It is possible that these authors assumed that the continuum emission is real, and does not suffer from OH-maser contamination, since it is not in the Becker et al. (1992) catalog. However, we note that such an assumption may not be correct in all cases, since the OH maser list of Becker et al. (1992) included only sources with a flux density > 10 mJy at 1611.7 MHz and undetected at 1441.5 MHz. So the exclusion from this list of the emission associated with IRAS 19508+2659 could just be because it fell below the emission threshold of 10 mJy in the 1611.7 MHz band.
To clarify whether or not IRAS 19508+2659 presents radio continuum emission, we downloaded the 20 cm data mentioned above (observed on 1983 December 30) from the VLA archive, and reprocessed them with the CASA package. In our images, we only detect emission at the position of IRAS 19508+2659 in the band centered at 1611.7 MHz, with a flux density of 10.1 ± 1.2 mJy, and unresolved by the synthesized beam of the images (6.5″ × 4.4″). The 3σ upper limit to the emission at 1441.5 MHz is 3 mJy. Therefore, there is certainly OH maser contamination in these data. OH maser emission ar 1612 MHz has indeed been reported toward this source, in different single-dish observations (e.g., Winnberg et al. 1981; Baud et al. 1981).
For a more complete check on the possible presence of radio continuum emission, we have downloaded the NVSS images at 1.4 GHz, and found no radio source at this position. The NVSS image has a rms noise of ≃0.8 mJy beam−1 (beam = 45″), so it is sensitive enough to detect a source with the reported values of 8–13 mJy. Moreover, no source at this position is listed in the catalog of radio continuum emission in the THOR survey (Wang et al. 2018, 2020) at 1–2 GHz, where they report 7σ upper limits of ≃2–5 mJy−1 beam−1 (beam ≃10″−25″). This limit should also have been enough to detect the previously reported flux densities. Considering that the free-free emission from ionized gas may be brighter at higher frequencies (unless it is already optically thin at 1.4 GHz, which is rare in planetary nebulae), we also downloaded the Very Large Array Sky Survey (VLASS, Lacy et al. 2020) images at 3 GHz, but we could not see any radio continuum associated with the source, with a 3σ upper limit of 3.6 mJy−1 beam−1 (beam = 3.1″ × 2.3″). Moreover, recent VLA observations (Cala et al. in prep) did not provide a detection of the source at 22 GHz, with a 3σ upper limit of ≃70 μJy beam−1 (beam ≃3.5″ × 2.6″). In the data presented here, we did not detect any emission at 7 mm, with 3σ upper limits of 140 and 160 μJy beam−1 (beam ≃1.13″ × 0.16″ at 43 GHz), at 43 and 45 GHz, respectively. Therefore, we must conclude the absence of radio continuum emission from IRAS 19508+2659, with very stringent upper limits at different frequencies.
In Fig. A.3, we show the SiO spectra toward IRAS 19508+2659. We only detect 28SiO emission of the v = 1 and v = 2 transitions. The position of the SiO maser emission and the emission at 1611.7 MHz (most likely arising from OH maser emission) are shown on an infrared image, in Fig. 4. Since there is no evidence for the presence of radio continuum emission, we then conclude that IRAS 19508+2659 is a regular AGB star.
5 Discussion
The lack of confirmed association between SiO maser emission and PNe in this work has different implications, depending on the sample. The negative results in sample 2 (Sect. 2.2) are due mainly to the fact that the reported radio continuum emission arises from a nearby, different source from that with SiO maser emission, and therefore, there seems to be no SiO-maser-emitting PN within the beam of the previously reported single-dish maser observations. However, our non-detection of SiO masers in nascent PNe (sample 1, Sect. 2.1) posses several interesting questions.
One question is whether the abundance of SiO in gas phase in our targets is not enough to provide the necessary column density of molecules for detectable emission. Moreover, even if SiO is present in the circumstellar environment of PNe, it may be located in regions without the necessary physical conditions for population inversion of the molecular levels, which is a prerequisite to produce maser emission. Of course, it is also possible that SiO masers may be emitted in PNe different from the ones we sampled, specially considering that we targeted PNe harboring masers of other molecular species typical of O-rich stars (OH and H2O).
The SiO abundance in gas phase tends to drop in circumstellar envelopes as a function of distance from the star, because it is depleted onto dust grains (e.g., Bujarrabal et al. 1986; Verbena et al. 2019). The SiO maser emission during the AGB phase is actually seen within ≲5 stellar radii, a distance shorter than the dust formation radius (Diamond et al. 1994). However, SiO may be released again in the presence of shocks. This is the case, for instance, of the “water fountain” sources W43A (probably a late AGB star) and IRAS 16552–3050 (a post-AGB star), objects with clear high-velocity bipolar outflows (Suárez et al. 2008; Tafoya et al. 2020), and which also show SiO maser emission (Nakashima & Deguchi 2003b; Amada et al. 2022). In W43A, this emission seems to trace the base of the bipolar outflow, at distances ≳10 au from the central star (Imai et al. 2005), larger than the radius of the SiO maser rings observed in typical AGB stars (<10 au, Diamond et al. 1994). High-velocity outflows and shocks are also present in PNe (e.g., Hajduk et al. 2024; Miranda et al. 2024), and the detection of water maser emission in some of the objects of our sample 2 is itself a tracer of shocks, since these are thought to be the main pumping mechanism of water masers. Therefore, one should reasonably expect that SiO molecules can be released from dust grains in some PNe.
An additional question for PNe is whether the SiO molecules can survive photoionization close to the hot, central star. Thermal SiO emission at millimeter wavelengths has been reported in the bipolar PN M2-48, using single-dish observations (Edwards & Ziurys 2014). Recent observations with the Atacama Large Millimeter Array of the nascent PN IRAS 15103–5754 (a source included in our sample 1) also show the presence of thermal SiO emission (Gómez et al. 2024). This emission is found at distances ≲400 au from the central star. Thus, SiO molecules can indeed be found in gas phase around PNe, but they might not be at close enough distances to the star to produce maser emission.
In the particular case of PNe showing OH and H2O maser emission, which comprise our sample 1 (Sect. 2.1), we note that Cala et al. (2024) found some evidence that they have dual chemistry, with O-rich external envelopes and C-rich central stars. If the innermost regions of the central envelopes, where one could expect SiO masers to be pumped, are actually C-rich, then this emission will not be produced, due to a lack of SiO molecules. In this case, carbon-bearing molecules may be dominant in the gas phase near the central star.
In summary, the question of the possibility of SiO maser emission around PNe is still open. Our two carefully selected samples comprised what probably were the best candidates to date for such a detection, but none was obtained. Our results clearly indicate that SiO masers, if present at all, are extremely rare. A definite answer about the possibility of finding SiO masers in PNe, and firm constraints for non-detections would require large-scale surveys and mappings of SiO maser emission in the Galactic plane and bulge. A promising example is the Bulge Asymmetries and Dynamical Evolution (BAaDE) survey (Lewis 2021; Sjouwerman 2023), which covers ≃28 000 sources, although it is still a targeted search, with a sample selected based on infrared colors. The MALT-45 survey (Jordan et al. 2015) includes the SiO lines we studied in this paper, although its coverage of the galactic plane is limited, with published results only for galactic coordinates 330° < l < 335°, |b| < 0.5°. A larger-scale blind SiO galactic mapping, as carried out for other maser species, like the Methanol Multibeam survey (Green et al. 2008), the Southern Parkes Large-Area Survey in Hydroxyl (SPLASH, Dawson et al. 2022), The HI/OH/Recombination line survey of the inner Milky Way (THOR, Beuther et al. 2016), or the H2O southern Galactic Plane Survey (HOPS, Walsh et al. 2011) may be necessary to avoid selection biases in the search for SiO-maser-emitting PNe.
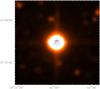 |
Fig. 4 K-band infrared image from the 2 MASS survey, centered at IRAS 19508+2659. The red cross marks the position of the radio continuum source reported by White et al. (2005), but that we argue it actually corresponds to OH maser emission (Sect. 4.2.5). The black cross is at the position of the SiO maser emission in our data. The blue circle is centered at the optical source Gaia DR3 4056748416698878592. Coordinates are in the equatorial (J2000) system. |
6 Conclusions
We have carried out a search for SiO maser emission in PNe. A total of 16 objects were observed in two source samples. We find no SiO maser emission associated with any confirmed or candidate PNe. Our non-detections indicate that SiO masers in PNe are extremely rare, if present at all. SiO molecules can be present in the gas phase in the circumstellar material of PNe, but probably not at the locations needed for efficient pumping of SiO masers. Since there is some evidence that PNe with OH and/or H2O masers have O-rich outer envelopes, but C-rich central stars and inner envelopes, we speculate that C-bearing molecules can be dominant at the inner locations where the physical conditions for SiO maser production may have been met.
Acknowledgements
The Australia Telescope Compact Array is part of the Australia Telescope National Facility (grid.421683.a) which is funded by the Australian Government for operation as a National Facility managed by CSIRO. We acknowledge the Gomeroi people as the traditional owners of the Observatory site. This work is financially supported by grants PID2020-114461GB-I00, PID2023-146295NB-I00, and CEX2021-001131-S, funded by MCIN/AEI /10.13039/501100011033, and by grant P20-00880, funded by the Economic Transformation, Industry, Knowledge and Universities Council of the Regional Government of Andalusia and the European Regional Development Fund from the European Union. RC also acknowledges support by the predoctoral grant PRE2018-085518, funded by MCIN/AEI/ 10.13039/501100011033 and by ESF Investing in your Future. We made use of the VLASS QLimage cutout server at URL cutouts.cirada.ca, operated by the Canadian Initiative for Radio Astronomy Data Analysis (CIRADA). CIRADA is funded by a grant from the Canada Foundation for Innovation 2017 Innovation Fund (Project 35999), as well as by the Provinces of Ontario, British Columbia, Alberta, Manitoba and Quebec, in collaboration with the National Research Council of Canada, the US National Radio Astronomy Observatory and Australia’s Commonwealth Scientific and Industrial Research Organisation.
Appendix A Additional figures
In this appendix we show the SiO(J=1–0) spectra of three of the sources detected in this paper: IRAS 17390–3014, IRAS 18052–2016, and IRAS 19508+2659. The spectra of IRAS 17239–2812 are presented in Fig. 1.
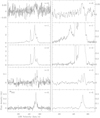 |
Fig. A.2 SiO(J=1-0) spectra of IRAS 18052–2016. The spectra on the right column are the same as those in the left one, but zooming in on the x and/or y axes, to better show the weakest components, except in the case of the v = 0 (both isotopologues) and v = 3 lines, which have been boxcar-smoothed to a spectral resolution of 0.88 km s−1, to increase the signal to noise ratio. |
References
- Acker, A., Raytchev, B., Koeppen, J., et al. 1991, A&AS, 89, 237 [NASA ADS] [Google Scholar]
- Acker, A., Marcout, J., Ochsenbein, F., et al. 1992, The Strasbourg-ESO Catalogue of Galactic Planetary Nebulae, Parts I, II (Garching, Germany: European Southern Observatory) [Google Scholar]
- Anglada, G., Rodríguez, L. F., & Carrasco-González, C. 2018, A&A Rev., 26, 3 [Google Scholar]
- Amada, K., Imai, H., Hamae, Y., et al. 2022, AJ, 163, 85 [NASA ADS] [CrossRef] [Google Scholar]
- Bachiller, R., Forveille, T., Huggins, P. J., et al. 1997, A&A, 324, 1123 [NASA ADS] [Google Scholar]
- Bains, I., Cohen, M., Chapman, J. M., et al. 2009, MNRAS, 397, 1386 [CrossRef] [Google Scholar]
- Baud, B., Habing, H. J., Matthews, H. E., et al. 1979a, A&AS, 35, 179 [NASA ADS] [Google Scholar]
- Baud, B., Habing, H. J., Matthews, H. E., et al. 1979b, A&AS, 36, 193 [NASA ADS] [Google Scholar]
- Baud, B., Habing, H. J., Matthews, H. E., et al. 1981, A&A, 95, 156 [NASA ADS] [Google Scholar]
- Becker, R. H., White, R. L., & Proctor, D. D. 1992, AJ, 103, 544 [NASA ADS] [CrossRef] [Google Scholar]
- Beuther, H., Bihr, S., Rugel, M., et al. 2016, A&A, 595, A32 [NASA ADS] [CrossRef] [EDP Sciences] [Google Scholar]
- Beuther, H., Walsh, A., Wang, Y., et al. 2019, A&A, 628, A90 [NASA ADS] [CrossRef] [EDP Sciences] [Google Scholar]
- Blöcker, T. 1995a, A&A, 297, 727 [NASA ADS] [Google Scholar]
- Blöcker, T. 1995b, A&A, 299, 755 [Google Scholar]
- Bowers, P. F., & Johnston, K. J. 1994, ApJS, 92, 189 [CrossRef] [Google Scholar]
- Bujarrabal, V., Planesas, P., Gomez-Gonzalez, J., et al. 1986, A&A, 162, 157 [NASA ADS] [Google Scholar]
- Cala, R. A., Gómez, J. F., Miranda, L. F., et al. 2022, MNRAS, 516, 2235 [CrossRef] [Google Scholar]
- Cala, R. A., Gómez, J. F., Miranda, L. F., et al. 2024, in Cosmic Masers: Proper Motion toward the Next-Generation Large Projects, IAU Symp 380, eds. T. Hirota, H. Imai, K. Menten, & Y. Pihlstrom (Cambridge: Cambridge University Press), 343 [Google Scholar]
- CASA Team (Bean, B., et al.) 2022, PASP, 134, 114501 [NASA ADS] [CrossRef] [Google Scholar]
- Caswell, J. L. 1997, MNRAS, 289, 203 [NASA ADS] [CrossRef] [Google Scholar]
- Cho, C.-Y., Cho, S.-H., Kim, S., et al. 2017, ApJS, 232, 13 [NASA ADS] [CrossRef] [Google Scholar]
- Clark, B. G. 1980, A&A, 89, 377 [NASA ADS] [Google Scholar]
- Condon, J. J., Cotton, W. D., Greisen, E. W., et al. 1998, AJ, 115, 1693 [Google Scholar]
- Dawson, J. R., Jones, P. A., Purcell, C., et al. 2022, MNRAS, 512, 3345 [NASA ADS] [CrossRef] [Google Scholar]
- Deacon, R. M., Chapman, J. M., & Green, A. J. 2004, ApJS, 155, 595 [NASA ADS] [CrossRef] [Google Scholar]
- Deacon, R. M., Chapman, J. M., Green, A. J., et al. 2007, ApJ, 658, 1096 [NASA ADS] [CrossRef] [Google Scholar]
- de Gregorio-Monsalvo, I., Gómez, Y., Anglada, G., et al. 2004, ApJ, 601, 921 [NASA ADS] [CrossRef] [Google Scholar]
- Deguchi, S., Fujii, T., Glass, I. S., et al. 2004, PASJ, 56, 765 [NASA ADS] [Google Scholar]
- Deguchi, S., Fujii, T., Ita, Y., et al. 2007, PASJ, 59, 559 [NASA ADS] [Google Scholar]
- Desmurs, J. F., Bujarrabal, V., Colomer, F., et al. 2000, A&A, 360, 189 [NASA ADS] [Google Scholar]
- Diamond, P. J., Kemball, A. J., Junor, W., et al. 1994, ApJ, 430, L61 [NASA ADS] [CrossRef] [Google Scholar]
- Dike, V., Morris, M. R., Rich, R. M., et al. 2021, AJ, 161, 111 [NASA ADS] [CrossRef] [Google Scholar]
- Douglas, J. N., Bash, F. N., Bozyan, F. A., et al. 1996, AJ, 111, 1945 [NASA ADS] [CrossRef] [Google Scholar]
- Edwards, J. L., & Ziurys, L. M. 2014, ApJ, 794, L27 [NASA ADS] [CrossRef] [Google Scholar]
- Ellingsen, S. P., Voronkov, M. A., Breen, S. L., et al. 2018, MNRAS, 480, 4851 [NASA ADS] [Google Scholar]
- Engels, D., & Jiménez-Esteban, F. 2007, A&A, 475, 941 [NASA ADS] [CrossRef] [EDP Sciences] [Google Scholar]
- Engels, D., & Lewis, B. M. 1996, A&AS, 116, 117 [NASA ADS] [Google Scholar]
- Engels, D., Schmid-Burgk, J., & Walmsley, C. M. 1986, A&A, 167, 129 [NASA ADS] [Google Scholar]
- Etoka, S., & Diamond, P. J. 2010, MNRAS, 406, 2218 [CrossRef] [Google Scholar]
- Fomalont, E. 1981, NRAO Newslett., 3, 3 [Google Scholar]
- Fujii, T., Deguchi, S., Ita, Y., et al. 2006, PASJ, 58, 529 [NASA ADS] [Google Scholar]
- García-Hernández, D. A., Perea-Calderón, J. V., Bobrowsky, M., et al. 2007, ApJ, 666, L33 [CrossRef] [Google Scholar]
- Gaia Collaboration (Prusti, T., et al.) 2016, A&A, 595, A1 [NASA ADS] [CrossRef] [EDP Sciences] [Google Scholar]
- Gaia Collaboration (Vallenari, A., et al.) 2023, A&A, 674, A1 [NASA ADS] [CrossRef] [EDP Sciences] [Google Scholar]
- Garwood, R. W., Perley, R. A., Dickey, J. M., et al. 1988, AJ, 96, 1655 [NASA ADS] [CrossRef] [Google Scholar]
- Gathier, R., Pottasch, S. R., Goss, W. M., et al. 1983, A&A, 128, 325 [NASA ADS] [Google Scholar]
- Gómez, Y., Moran, J. M., & Rodríguez, L. F. 1990, Rev. Mexicana Astron. Astrofis., 20, 55 [Google Scholar]
- Gómez, J. F., de Gregorio-Monsalvo, I., Lovell, J. E. J., et al. 2005, MNRAS, 364, 738 [CrossRef] [Google Scholar]
- Gómez, J. F., Suárez, O., Gómez, Y., et al. 2008, AJ, 135, 2074 [CrossRef] [Google Scholar]
- Gómez, J. F., Suárez, O., Bendjoya, P., et al. 2015, ApJ, 799, 186 [CrossRef] [Google Scholar]
- Gómez, J. F., Uscanga, L., Green, J. A., et al. 2016, MNRAS, 461, 3259 [CrossRef] [Google Scholar]
- Gómez, J. F., Cala, R. A., Miranda, L. F., et al. 2024, in Cosmic Masers: Proper Motion toward the Next-Generation Large Projects, IAU Symp 380, eds. T. Hirota, H. Imai, K. Menten, & Y. Pihlstrom (Cambridge: Cambridge University Press), 374 [Google Scholar]
- Gordon, Y. A., Boyce, M. M., O’Dea, C. P., et al. 2021, ApJS, 255, 30 [NASA ADS] [CrossRef] [Google Scholar]
- Green, J. A., Caswell, J. L., Fuller, G. A., et al. 2008, MNRAS, 385, 948 [NASA ADS] [CrossRef] [Google Scholar]
- Guerrero, M. A., Toalá, J. A., Medina, J. J., et al. 2013, A&A, 557, A121 [NASA ADS] [CrossRef] [EDP Sciences] [Google Scholar]
- Hajduk, M., van Hoof, P. A. M., Zijlstra, A. A., et al. 2024, A&A, 688, L21 [NASA ADS] [CrossRef] [EDP Sciences] [Google Scholar]
- Hall, P. J., Wright, A. E., Troup, E. R., et al. 1990, MNRAS, 247, 549 [NASA ADS] [Google Scholar]
- Haro, G. 1952, Bol. Observ. Tonantzintla Tacubaya, 1, [Google Scholar]
- Henize, K. G. 1967, ApJS, 14, 125 [NASA ADS] [CrossRef] [Google Scholar]
- Imai, H., Nakashima, J., Diamond, P.J., et al. 2005, ApJ, 622, L125 [NASA ADS] [CrossRef] [Google Scholar]
- Iwanek, P., Soszyński, I., Kozłowski, S., et al. 2022, ApJS, 260, 46 [NASA ADS] [CrossRef] [Google Scholar]
- Izumiura, H., Catchpole, R., Deguchi, S., et al. 1995, ApJS, 98, 271 [NASA ADS] [CrossRef] [Google Scholar]
- Jacoby, G. H., & Van de Steene, G. 2004, A&A, 419, 563 [NASA ADS] [CrossRef] [EDP Sciences] [Google Scholar]
- Jewell, P. R., Snyder, L. E., Walmsley, C. M., et al. 1991, A&A, 242, 211 [NASA ADS] [Google Scholar]
- Jordan, C. H., Walsh, A. J., Lowe, V., et al. 2015, MNRAS, 448, 2344 [NASA ADS] [CrossRef] [Google Scholar]
- Kimeswenger, S. 2001, Rev. Mexicana Astron. Astrofis., 37, 115 [Google Scholar]
- Lacy, M., Baum, S. A., Chandler, C. J., et al. 2020, PASP, 132, 035001 [Google Scholar]
- Lewis, M. O. 2021, PhD thesis, University of New Mexico, USA [Google Scholar]
- Lewis, B. M., & Engels, D. 1988, Nature, 332, 49 [NASA ADS] [CrossRef] [Google Scholar]
- Lovas, F. J., & Dragoset, R. A., in NIST Recommended Rest Frequencies for Observed Interstellar Molecular Microwave Transitions – 2002 Revision (version 2.0.1). Available: http://physics.nist.gov/restfreq (2009, February 4) (Gaithersburg, MD: National Institute of Standards and Technology) [Google Scholar]
- Menten, K. M., Wyrowski, F., Keller, D., et al. 2018, A&A, 613, A49 [NASA ADS] [CrossRef] [EDP Sciences] [Google Scholar]
- Miller Bertolami, M. M. 2016, A&A, 588, A25 [NASA ADS] [CrossRef] [EDP Sciences] [Google Scholar]
- Miranda, L. F., Torrelles, J. M., Guerrero, M. A., et al. 1998, MNRAS, 298, 243 [NASA ADS] [CrossRef] [Google Scholar]
- Miranda, L. F., Gómez, Y., Anglada, G., et al. 2001, Nature, 414, 284 [NASA ADS] [CrossRef] [Google Scholar]
- Miranda, L. F., Vázquez, R., Olguín, L., et al. 2024, A&A, 687, A123 [NASA ADS] [CrossRef] [EDP Sciences] [Google Scholar]
- Müller, H. S. P., Schlöder, F., Stutzki, J., & Winnewisser, G. 2005, J. Mol. Struct. 742, 215 [Google Scholar]
- Murphy, T., Mauch, T., Green, A., et al. 2007, MNRAS, 382, 382 [Google Scholar]
- Nakashima, J.-I., & Deguchi, S. 2003a, PASJ, 55, 203 [NASA ADS] [CrossRef] [Google Scholar]
- Nakashima, J.-I., & Deguchi, S. 2003b, PASJ, 55, 229 [NASA ADS] [Google Scholar]
- Nyman, L.-A., Hall, P. J., & Olofsson, H. 1998, A&AS, 127, 185 [NASA ADS] [CrossRef] [EDP Sciences] [Google Scholar]
- Panagia, N., & Felli, M. 1975, A&A, 39, 1 [Google Scholar]
- Payne, H. E., Phillips, J. A., & Terzian, Y. 1988, ApJ, 326, 368 [NASA ADS] [CrossRef] [Google Scholar]
- Pottasch, S. R., Bignell, C., & Zijlstra, A. 1987, A&A, 177, L49 [NASA ADS] [Google Scholar]
- Qiao, H.-H., Walsh, A. J., Green, J. A., et al. 2016a, ApJS, 227, 26 [NASA ADS] [CrossRef] [Google Scholar]
- Qiao, H.-H., Walsh, A. J., Gómez, J. F., et al. 2016b, ApJ, 817, 37 [CrossRef] [Google Scholar]
- Qiao, H.-H., Walsh, A. J., Breen, S. L., et al. 2018, ApJS, 239, 15 [NASA ADS] [CrossRef] [Google Scholar]
- Qiao, H.-H., Breen, S. L., Gómez, J. F., et al. 2020, ApJS, 247, 5 [NASA ADS] [CrossRef] [Google Scholar]
- Reid, M. J., Muhleman, D. O., Moran, J. M., et al. 1977, ApJ, 214, 60 [NASA ADS] [CrossRef] [Google Scholar]
- Reid, M. J., & Menten, K. M. 2007, ApJ, 671, 2068 [NASA ADS] [CrossRef] [Google Scholar]
- Reynolds, S. P. 1986, ApJ, 304, 713 [NASA ADS] [CrossRef] [Google Scholar]
- Richards, A. M. S., Etoka, S., Gray, M. D., et al. 2012, A&A, 546, A16 [NASA ADS] [CrossRef] [EDP Sciences] [Google Scholar]
- Sánchez Contreras, C., Desmurs, J. F., Bujarrabal, V., et al. 2002, A&A, 385, L1 [NASA ADS] [CrossRef] [EDP Sciences] [Google Scholar]
- Sault, R. J., Teuben, P. J., & Wright, M. C. H. 1995, Astron. Data Anal. Softw. Syst. IV, 77, 433 [NASA ADS] [Google Scholar]
- Seaquist, E. R., & Davis, L. E. 1983, ApJ, 274, 659 [NASA ADS] [CrossRef] [Google Scholar]
- Sevenster, M. N., Chapman, J. M., Habing, H. J., et al. 1997a, A&AS, 122, 79 [NASA ADS] [CrossRef] [EDP Sciences] [Google Scholar]
- Sevenster, M. N., Chapman, J. M., Habing, H. J., et al. 1997b, A&AS, 124, 509 [NASA ADS] [CrossRef] [EDP Sciences] [Google Scholar]
- Sivagnanam, P., Le Squeren, A. M., Minh, F. T., et al. 1990, A&A, 233, 112 [NASA ADS] [Google Scholar]
- Sjouwerman, L. 2023, in Cosmic Masers: Proper Motion toward the Next-Generation Large Projects, IAU Symp 380, eds. T. Hirota, H. Imai, K. Menten, & Y. Pihlstrom (Cambridge: Cambridge University Press), in press [Google Scholar]
- Skrutskie, M. F., Cutri, R. M., Stiening, R., et al. 2006, AJ, 131, 1163 [NASA ADS] [CrossRef] [Google Scholar]
- Spitzer Science, C. 2009, VizieR Online Data Catalog, 2293, II/293 [Google Scholar]
- Stevens, J., Wark, R., Edwards, P., et al. 2015, ATCA Users Guide, Revision 1.10, http://www.narrabri.atnf.csiro.au/observing/users_guide/html/atug.html [Google Scholar]
- Suárez, O., García-Lario, P., Manchado, A., et al. 2006, A&A, 458, 173 [NASA ADS] [CrossRef] [EDP Sciences] [Google Scholar]
- Suárez, O., Gómez, J. F., & Morata, O. 2007, A&A, 467, 1085 [NASA ADS] [CrossRef] [EDP Sciences] [Google Scholar]
- Suárez, O., Gómez, J. F., & Miranda, L. F. 2008, ApJ, 689, 430 [CrossRef] [Google Scholar]
- Suárez, O., Gómez, J. F., Bendjoya, P., et al. 2015, ApJ, 806, 105 [CrossRef] [Google Scholar]
- Tafoya, D., Gómez, Y., Patel, N. A., et al. 2009, ApJ, 691, 611 [NASA ADS] [CrossRef] [Google Scholar]
- Tafoya, D., Imai, H., Gómez, J. F., et al. 2020, ApJ, 890, L14 [NASA ADS] [CrossRef] [Google Scholar]
- te Lintel Hekkert, P., Caswell, J. L., Habing, H. J., et al. 1991, A&AS, 90, 327 [NASA ADS] [Google Scholar]
- Turner, B. E. 1979, A&AS, 37, 1 [NASA ADS] [Google Scholar]
- Uscanga, L., Gómez, J. F., Suárez, O., et al. 2012, A&A, 547, A40 [NASA ADS] [CrossRef] [EDP Sciences] [Google Scholar]
- Uscanga, L., Gómez, J. F., Miranda, L. F., et al. 2014, MNRAS, 444, 217 [NASA ADS] [CrossRef] [Google Scholar]
- Vassiliadis, E., & Wood, P. R. 1993, ApJ, 413, 641 [Google Scholar]
- Vassiliadis, E., & Wood, P. R. 1994, ApJS, 92, 125 [NASA ADS] [CrossRef] [Google Scholar]
- Verbena, J. L., Bujarrabal, V., Alcolea, J., et al. 2019, A&A, 624, A107 [EDP Sciences] [Google Scholar]
- Vyssotsky, A. N., Miller, W. J., & Walther, M. E. 1945, PASP, 57, 314 [NASA ADS] [CrossRef] [Google Scholar]
- Walsh, A. J., Breen, S. L., Britton, T., et al. 2011, MNRAS, 416, 1764 [Google Scholar]
- Wang, Y., Bihr, S., Rugel, M., et al. 2018, A&A, 619, A124 [NASA ADS] [CrossRef] [EDP Sciences] [Google Scholar]
- Wang, Y., Bihr, S., Rugel, M., et al. 2020, A&A, 641, C1 [NASA ADS] [CrossRef] [EDP Sciences] [Google Scholar]
- White, R. L., Becker, R. H., & Helfand, D. J. 2005, AJ, 130, 586 [NASA ADS] [CrossRef] [Google Scholar]
- Winnberg, A., Terzides, C., & Matthews, H. E. 1981, AJ, 86, 410 [NASA ADS] [CrossRef] [Google Scholar]
- Yoon, D.-H., Cho, S.-H., Kim, J., et al. 2014, ApJS, 211, 15 [NASA ADS] [CrossRef] [Google Scholar]
- Zijlstra, A. A., te Lintel Hekkert, P., Pottasch, S. R., et al. 1989, A&A, 217, 157 [NASA ADS] [Google Scholar]
- Zoonematkermani, S., Helfand, D. J., Becker, R. H., et al. 1990, ApJS, 74, 181 [NASA ADS] [CrossRef] [Google Scholar]
All Tables
Radio continuum emission and representative SiO upper limits in confirmed and candidate PNe with OH and/or H2O masers (sample 1).
All Figures
|
Fig. 1 SiO (J=1–0) spectra of IRAS 17239–2812. The spectra on the right column are the same as those in the left one (no spectral smoothing applied), but zooming in on the x and/or y axes, to better show the weakest components. The spectra of the other objects presented in this paper are shown in Appendix A. |
| In the text | |
|
Fig. 2 K-band infrared image from the 2MASS survey, centered at IRAS 17239–2812. The white cross marks the location of the radio source NVSS J172702–281525, the black cross is at the position of the SiO maser emission in our data, and the green square is at the catalog position of TXS 1723–282. The blue circle is centered at the optical source Gaia DR3 4059869891553026048. Coordinates are in the equatorial (equinox J2000) system. |
| In the text | |
|
Fig. 3 K-band infrared image from the 2 MASS survey, centered at IRAS 17390–3014. The white cross marks the center of the Gaussian fit to the radio source NVSS J174218–301526, while the white ellipse represents the full width at half maximum size of this fit. The black cross is at the position of the SiO maser emission in our data. The blue circle is centered at the optical source Gaia DR3 4056748416698878592. Coordinates are in the equatorial (equinox J2000) system. |
| In the text | |
|
Fig. 4 K-band infrared image from the 2 MASS survey, centered at IRAS 19508+2659. The red cross marks the position of the radio continuum source reported by White et al. (2005), but that we argue it actually corresponds to OH maser emission (Sect. 4.2.5). The black cross is at the position of the SiO maser emission in our data. The blue circle is centered at the optical source Gaia DR3 4056748416698878592. Coordinates are in the equatorial (J2000) system. |
| In the text | |
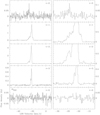 |
Fig. A.1 Same as Fig. 1, but for IRAS 17390–3014. |
| In the text | |
|
Fig. A.2 SiO(J=1-0) spectra of IRAS 18052–2016. The spectra on the right column are the same as those in the left one, but zooming in on the x and/or y axes, to better show the weakest components, except in the case of the v = 0 (both isotopologues) and v = 3 lines, which have been boxcar-smoothed to a spectral resolution of 0.88 km s−1, to increase the signal to noise ratio. |
| In the text | |
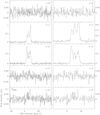 |
Fig. A.3 Same as Fig. 1, but for IRAS 19508+2659. |
| In the text | |
Current usage metrics show cumulative count of Article Views (full-text article views including HTML views, PDF and ePub downloads, according to the available data) and Abstracts Views on Vision4Press platform.
Data correspond to usage on the plateform after 2015. The current usage metrics is available 48-96 hours after online publication and is updated daily on week days.
Initial download of the metrics may take a while.