Fig. 3
Download original image
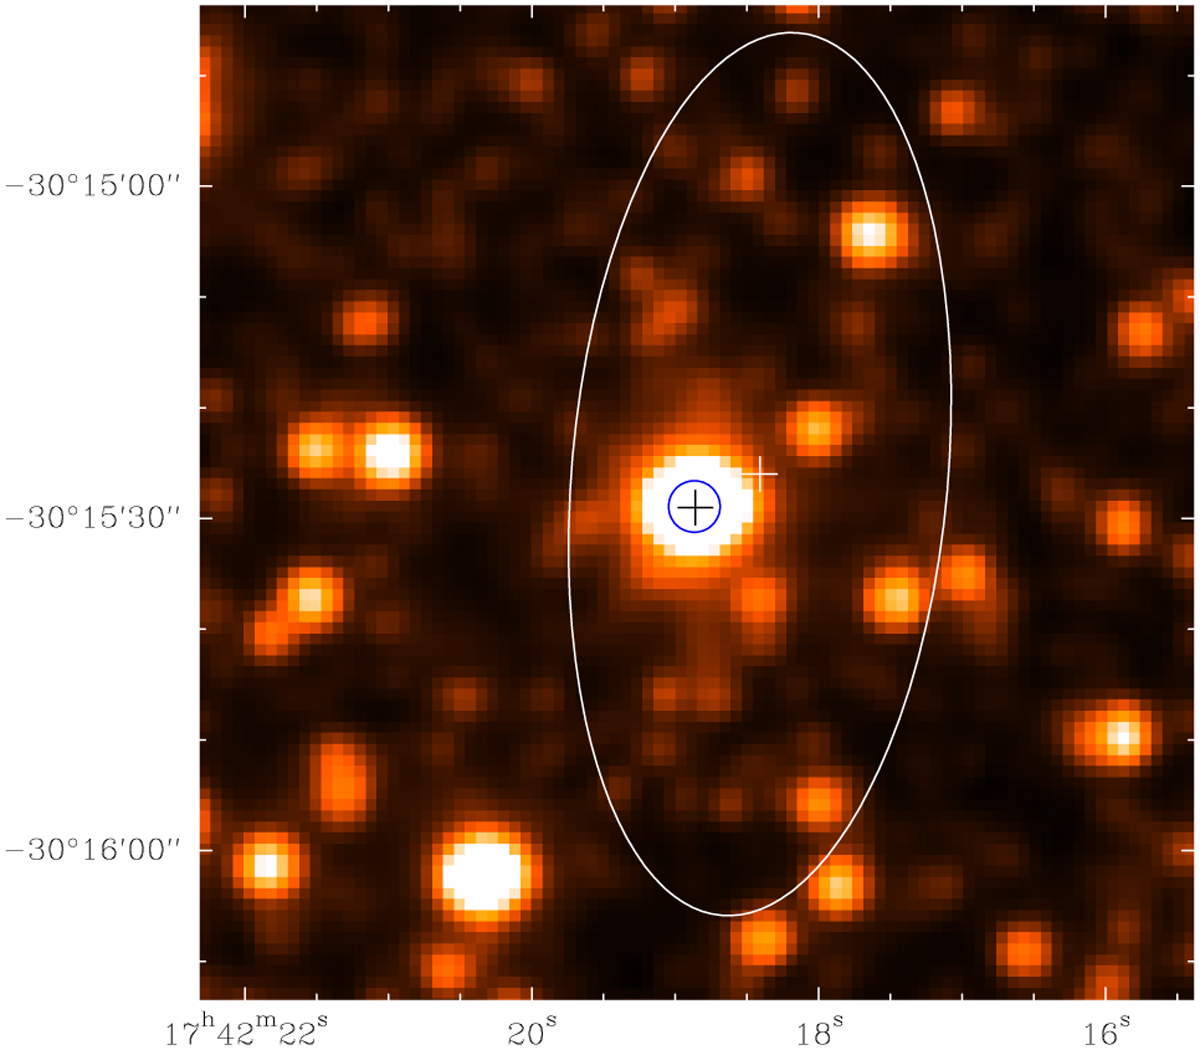
K-band infrared image from the 2 MASS survey, centered at IRAS 17390–3014. The white cross marks the center of the Gaussian fit to the radio source NVSS J174218–301526, while the white ellipse represents the full width at half maximum size of this fit. The black cross is at the position of the SiO maser emission in our data. The blue circle is centered at the optical source Gaia DR3 4056748416698878592. Coordinates are in the equatorial (equinox J2000) system.
Current usage metrics show cumulative count of Article Views (full-text article views including HTML views, PDF and ePub downloads, according to the available data) and Abstracts Views on Vision4Press platform.
Data correspond to usage on the plateform after 2015. The current usage metrics is available 48-96 hours after online publication and is updated daily on week days.
Initial download of the metrics may take a while.