Open Access
Fig. 1
Download original image
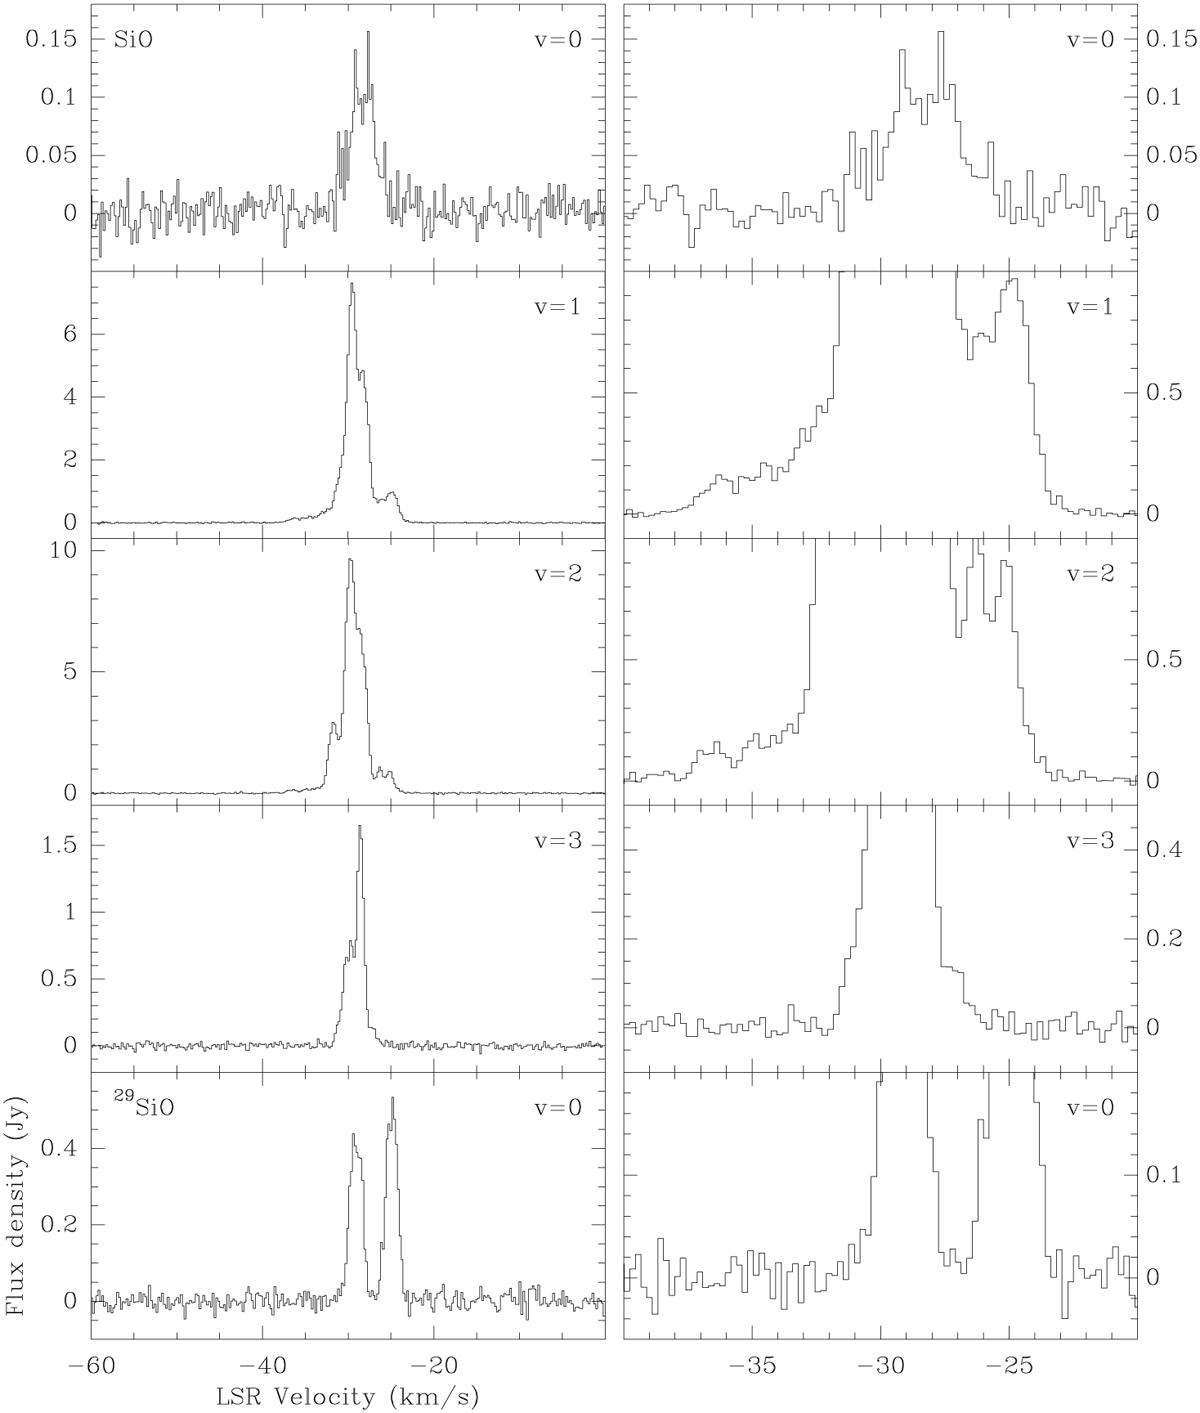
SiO (J=1–0) spectra of IRAS 17239–2812. The spectra on the right column are the same as those in the left one (no spectral smoothing applied), but zooming in on the x and/or y axes, to better show the weakest components. The spectra of the other objects presented in this paper are shown in Appendix A.
Current usage metrics show cumulative count of Article Views (full-text article views including HTML views, PDF and ePub downloads, according to the available data) and Abstracts Views on Vision4Press platform.
Data correspond to usage on the plateform after 2015. The current usage metrics is available 48-96 hours after online publication and is updated daily on week days.
Initial download of the metrics may take a while.