Open Access
Fig. 4
Download original image
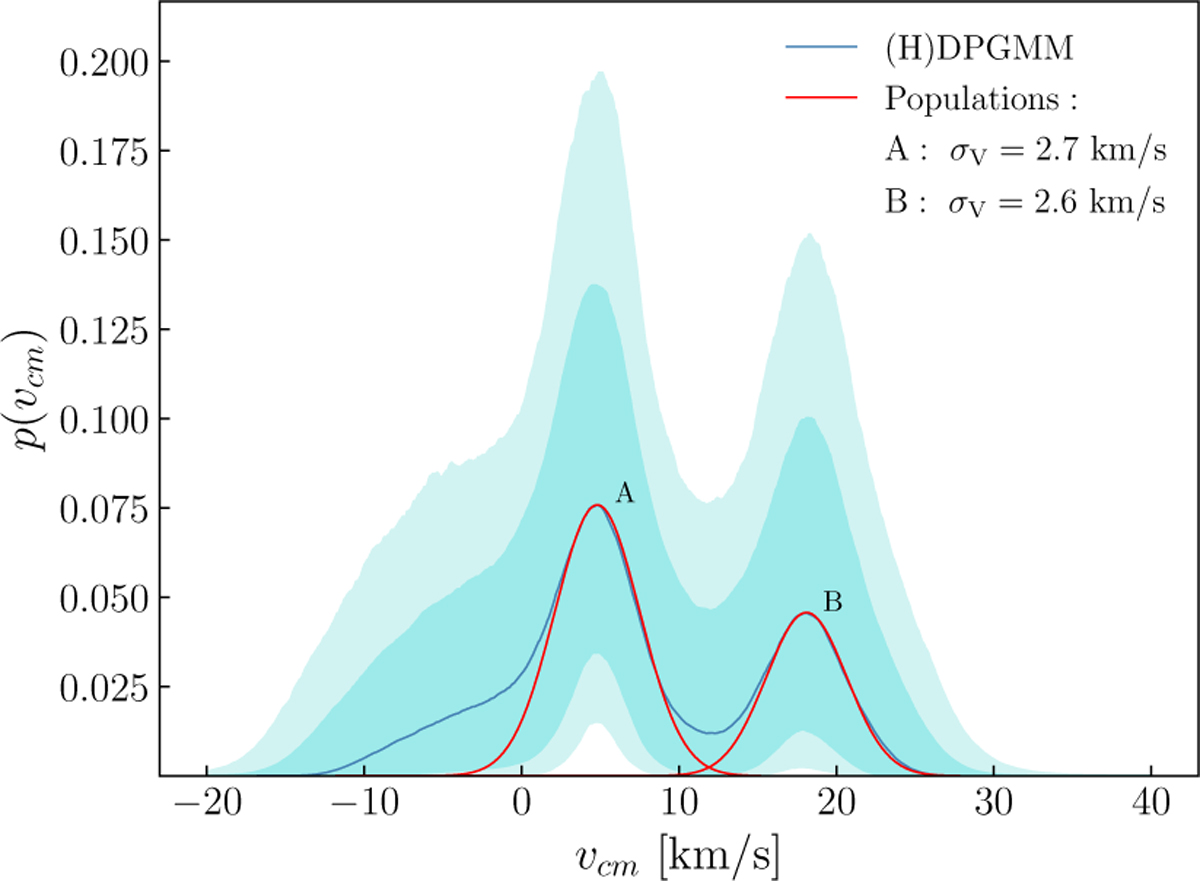
Centre-of-mass radial velocity distribution of the 20 stars from Ramírez-Tannus et al. (2024) using all the available epochs. The blue line marks the median recovered distribution and the shaded areas correspond to the 68% and 90% credible regions. The red lines marks the two estimated vcm distributions.
Current usage metrics show cumulative count of Article Views (full-text article views including HTML views, PDF and ePub downloads, according to the available data) and Abstracts Views on Vision4Press platform.
Data correspond to usage on the plateform after 2015. The current usage metrics is available 48-96 hours after online publication and is updated daily on week days.
Initial download of the metrics may take a while.