Fig. 3
Download original image
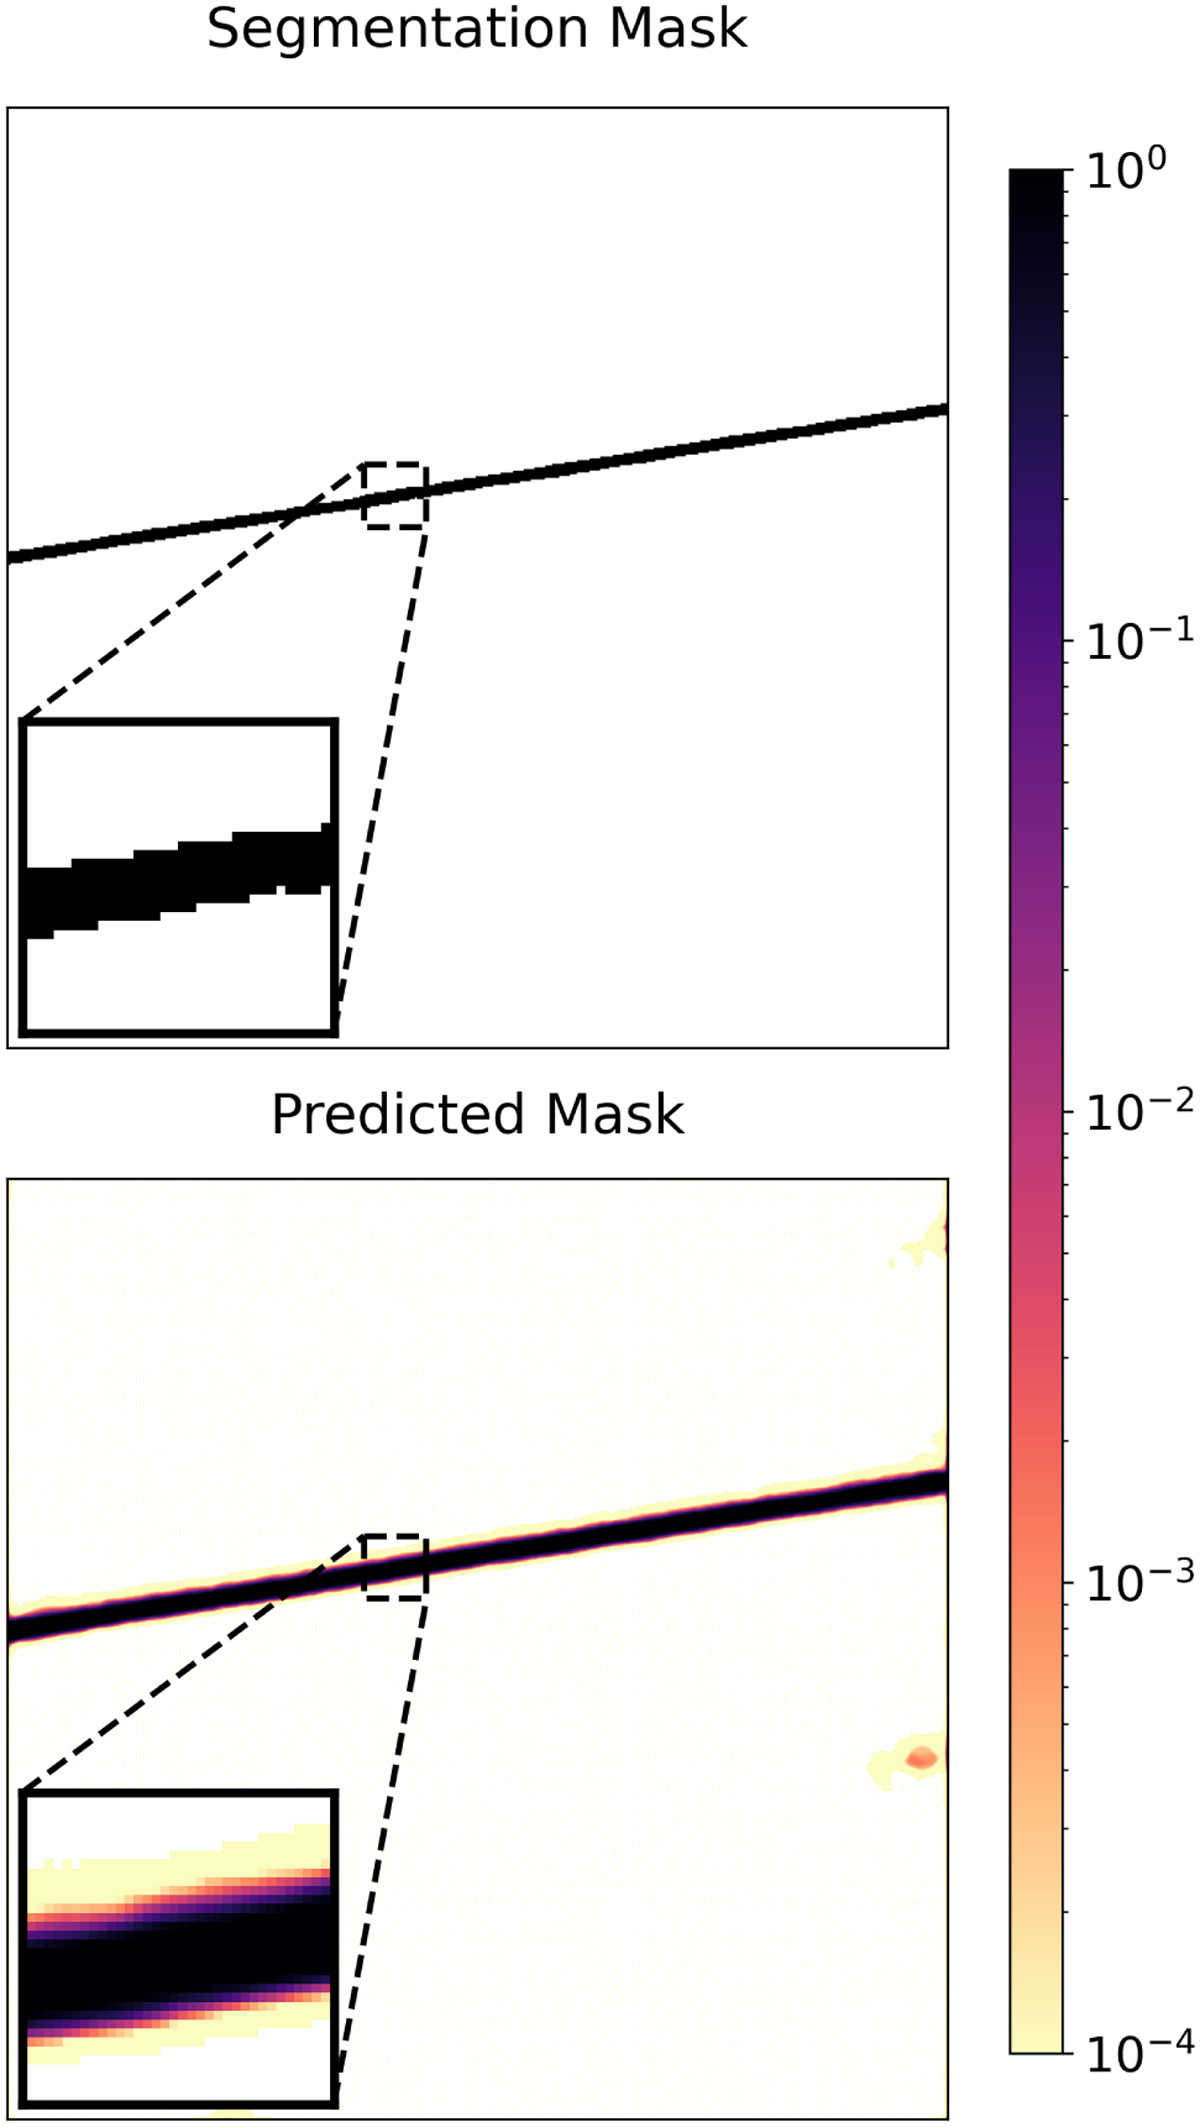
Comparison of ground truth segmentation mask and U-Net predicted segmentation map. The top panel shows the ground truth segmentation mask with satellite trails marked in black. The bottom panel shows the U-Net predicted segmentation map, with pixel values ranging from 0 to 1, indicating the likelihood of each pixel belonging to a satellite trail. The insets provide a zoomed-in view to highlight the detailed accuracy of the predictions.
Current usage metrics show cumulative count of Article Views (full-text article views including HTML views, PDF and ePub downloads, according to the available data) and Abstracts Views on Vision4Press platform.
Data correspond to usage on the plateform after 2015. The current usage metrics is available 48-96 hours after online publication and is updated daily on week days.
Initial download of the metrics may take a while.