| Issue |
A&A
Volume 692, December 2024
|
|
|---|---|---|
| Article Number | A33 | |
| Number of page(s) | 12 | |
| Section | Atomic, molecular, and nuclear data | |
| DOI | https://doi.org/10.1051/0004-6361/202451652 | |
| Published online | 29 November 2024 | |
Spectrum and energy levels of the high-lying singly excited configurations of Nd III
New Nd III experimental energy levels and wavelengths, with transition probability and ionisation energy calculations
1
Physics Department, Imperial College London,
Prince Consort Road,
London
SW7 2AZ,
UK
2
Institute of Spectroscopy, Russian Academy of Sciences,
Troitsk,
Moscow
108840,
Russia
3
Institute of Astronomy, Russian Academy of Sciences,
Pyatnitskaya 48,
Moscow
119017,
Russia
★ Corresponding author; This email address is being protected from spambots. You need JavaScript enabled to view it.
Received:
25
July
2024
Accepted:
18
October
2024
Abstract
Aims. We aim to accurately determine bound-to-bound transition wavelengths and energy levels of the high-lying open-shell configurations 4f37s, 4f36d, and 4f35f of doubly ionised neodymium (Nd III, Z = 60) through high-resolution spectroscopy and semi-empirical calculations. This study is motivated by lanthanide atomic data requirements in astronomy, such those involved in investigations of kilonova spectra.
Methods. Fourier transform spectra of Nd Penning and hollow cathode discharge lamps were recorded within the region 32500–54000 cm−1 (3077–1852 Å) and grating spectra of Nd vacuum sliding sparks were recorded within the regions 820–1159 Å and 1600–3250 Å. New energy levels were found using the observed wavelengths measured accurate to a few parts in 108 in Fourier transform spectra and to a few parts in 107 in grating spectra. Atomic structure and transition probability calculations of Nd III were carried out using the Cowan codes, where energy parameters were adjusted to fit all known Nd III levels. Finally, Nd-rich stellar spectra were also used to aid in the analysis.
Results. In total, 355 transitions were classified from observed spectra involving 116 previously experimentally unknown energy levels of the 4f37s, 4f36d, and 4f35f configurations of Nd III, all reported here for the first time. Three newly identified levels of the 4f35d configuration and one newly identified 4f4 level are also reported. Typical level energy uncertainties are 0.01 cm−1 for the 4f37s and 4f36d levels and 0.3 cm−1 for the 4f35f levels. In addition, calculated energy levels up to 130 936 cm−1 are presented, including eigenvector composition and calculated level lifetimes. Calculated transition probabilities and wavelengths between 1900–50 000 Å are also given. Using newly established levels of the 4f37s configuration and the recently established levels of the 4f36s configuration, the ionisation energy of Nd III has been estimated at 178 090 ± 330 cm−1. This result offers up to twice the accuracy of the most recently published value.
Key words: atomic data / line: identification / methods: data analysis / methods: laboratory: atomic / stars: abundances / stars: chemically peculiar
© The Authors 2024
 Open Access article, published by EDP Sciences, under the terms of the Creative Commons Attribution License (https://creativecommons.org/licenses/by/4.0), which permits unrestricted use, distribution, and reproduction in any medium, provided the original work is properly cited.
This article is published in open access under the Subscribe to Open model. This email address is being protected from spambots. You need JavaScript enabled to view it. to support open access publication.
1 Introduction
Astronomical interest in lanthanide elements (Z = 57–71) has risen greatly since the detection of neutron star merger event GW170817 and its electromagnetic counterpart AT2017gfo (Abbott et al. 2017). The accuracy and completeness of lanthanide atomic data is essential for disentangling the spectra of kilonovae (e.g. Kasen et al. 2013; Tanaka & Hotokezaka 2013; Smartt et al. 2017; Tanaka et al. 2018, 2020; Watson et al. 2019; Gaigalas et al. 2019; Fontes et al. 2020; Even et al. 2020; Cowan et al. 2021; Domoto et al. 2022; Brethauer et al. 2024). Furthermore, doubly ionised neodymium (Nd III, Z = 60) is expected to strongly influence kilonovae spectra at shorter wavelengths (UV to far-UV e.g. Silva et al. 2022; Flörs et al. 2023). In this work, we aimed to experimentally determine high-lying energy levels of Nd III responsible for many of its strong transitions in the UV, which will aid kilonova opacity investigations at shorter wavelengths. Experimental investigation of lanthanide element atomic structure using high-resolution spectroscopy is a key step in addressing the need for complete and accurate knowledge of their spectral data. Wavelengths of measured transitions and of weak lines deduced from experimentally established energy levels will fulfill wavelength accuracy requirements. Furthermore, theoretical atomic structure model parameters can be significantly improved by benchmarking and adjusting them against experimental level energies that are many orders of magnitude more accurate than their calculations.
The original experimental investigations of Nd III atomic structure, carried out by Dieke et al. (1961) and Dieke & Crosswhite (1963), identified 29 energy levels of the 4f4 and 4f35d configurations. These results were extended decades later by Aldenius (2001), Ryabchikova et al. (2006), and Ding et al. (2024). In the present work, we have extended the work of Ding et al. (2024), which reported the classification of 623 transitions of 105 new and 39 improved energy levels of the 4f4, 4f35d, 4f36s, and 4f36p configurations of Nd III. In total, 355 additional transitions of Nd III are further classified by Fourier transform (FT) and grating spectroscopy of Nd discharge sources, which determined 116 new energy levels of the 4f37s, 4f36d, and 4f35f configurations for the first time. The further analysis of stellar absorption spectra of Nd III has also led to the identification of four levels of the 4f4 and 4f35d configurations, increasing the total number of known levels of Nd III to 264.
Energy level mixing and configuration interaction effects are essential considerations in atomic structure models for the lanthanide species. Identifying levels across a broad range of energies and configurations provides better parameter constraints and allows more accurate wavelength and transition probability (TP) calculations. We carried out comprehensive semi-empirical atomic structure and TP calculations for Nd III using the Cowan codes (Cowan 1981; Kramida 2021). The energy parameters were fitted using all 264 known energy levels of the 4f3(4f, 5d, 6s, 6p, 7s, 6d, and 5f) configurations, lying in the ranges 0– 131000 cm−1 and 15 158–111 138 cm−1 for the even and odd systems, respectively. These results will be crucial guidance for a range of future Nd III spectral analyses in addition to kilonovae investigations, such as further empirical Nd III atomic structure determinations, estimating missing branching fractions in Nd III transition probability measurements, and stellar absorption line modelling for chemically peculiar stars (e.g. Przybylski 1977; Cowley et al. 2000; Ryabchikova et al. 2006) as well as their pulsational wave propagations (e.g. Savanov et al. 1999; Ryabchikova et al. 2007).
The ionisation energy is one of the fundamental constants of an ion, which is also important for modelling astrophysical plasma conditions. Adopting the method from Sugar & Reader (1973), the Nd III ionisation energy is estimated to be 178 070 ± 330 cm−1 using previously unknown experimental level energies.
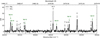 |
Fig. 1 Section of the Nd-Ar PDL FT spectrum (solid line) containing many 4f36p–4f3(7s + 6d) transitions in its neighbourhood. The corresponding section of the Nd-Ar HCL spectrum is shown using the dash-dotted line. Six 4f36p–4f36d transitions of Nd III are marked, the two Ar lines were classified by comparison with observed lines of Saloman (2010); Kramida et al. (2023). The wavenumber of this section is above all Ritz wavenumbers of allowed E1 transitions between known energy levels of Nd I-II (Blaise et al. 1971, 1984; Martin et al. 1978; Kramida et al. 2023), and no classified Nd IV transitions (Wyart et al. 2007; Deghiche et al. 2015) matched the lines marked as ‘U’. Wavelengths and wavenumbers are given as vacuum values. |
2 Experimental details
The full experimental details of the majority of the atomic emission spectra analysed in the present work are given in Ding (2024) and Ding et al. (2024). Therefore, we only provide summaries in this section. Prior to wavelength and relative intensity calibration, the wavelengths and relative intensities of each spectral line were obtained by fitting the spectra using model line profiles, and resulting line parameters were tabulated as line lists for the subsequent energy level analysis.
2.1 Fourier transform spectroscopy of Nd
The FT spectra used in this work were the two spectra of a Nd–Ar Penning discharge lamp (PDL, e.g. Finley et al. 1979; Heise et al. 1994) reported (and labelled as E and F) in Table 2 of Ding et al. (2024), covering the regions 32480–44422 cm−1 (3079–2251 Å) and 44422–53 822 cm−1 (2251–1858 Å), respectively. These were recorded on the high-resolution f/25 Imperial College VUV FT spectrometer (Thorne et al. 1987) at resolutions 0.07 and 0.08 cm−1, respectively, which were chosen such that the resolving power was limited by the Doppler width of the PDL spectral lines. The PDL cathodes were 99.5% pure Nd and run with argon carrier gas at a current of 750 mA for both spectra and at pressures of 1.7×10⁻³ and 2.0×10⁻³ mbar respectively. The observed wavenumbers were calibrated using Ar II standard lines recommended by Learner & Thorne (1988) and measured by Whaling et al. (1995). Wavenumber uncertainties of non-blended, non-self-absorbed lines with signal-to-noise ratio (S/N) greater than 100 in these two spectra were no more than 0.003 cm−1 (~0.0003 Å at 3000 Å). The spectra were intensity calibrated to a relative scale using a deuterium standard lamp.
Two Nd-Ar hollow cathode lamp (HCL) spectra had also been recorded in exactly the same spectral regions in Ding et al. (2024). Compared to the PDL, transitions from higher-lying levels are expected to have lower intensities in the HCL due to its lower effective temperature and lower level populations for higher-lying levels. The4f3 6p–4f37s and 4f36p–4f36d transitions used in the present work to find the 4f37s and 4f36d levels were notably not observed in these two HCL spectra, and this aided their classifications. This is evident in Fig. 1, where an example section of spectrum recorded with PDL and HCL is shown.
2.2 Grating spectroscopy of Nd
The grating spectra used in this work include all four Nd vacuum spark (VS) spectra presented in Table 3 of Ding et al. (2024), and these were recorded at VS currents up to 1500 A. Two of these spectra were recorded using the 6.65 m normal incidence spectrograph at the Institute of Spectroscopy in Troitsk using photographic plates, spanning the regions 390–1525 Å and 1600–2536 Å. The other two spectra were recorded using the 10.7 m normal incidence spectrograph at the National Institude of Standards and Technology (NIST), covering 2330–3250 Å, also using photographic plates. Impurity lines of oxygen, carbon, nitrogen, and silicon in various ionisation stages (Kramida et al. 2023), as well as lines of Nd IV (Wyart et al. 2007) and Nd V (Meftah et al. 2008), were used for wavelength calibration in the range 390–1525 Å. The other grating spectra were wavelength calibrated using Nd III Ritz wavelengths determined in Ding et al. (2024). Relative intensities were calibrated using approximate plate response curves and sensitivities. The wavelength uncertainty was estimated at ±0.006 Å using the root-mean-square (rms) deviations of wavelengths from corresponding reference wavelengths. Due to the much higher currents of the VS discharges, the weaker transitions from high-lying Nd III levels that were either around the noise level or absent in the Nd–Ar PDL FT spectra were of moderate intensity in the Nd VS grating spectra.
Additionally, a line list of a grating spectrum in the range 820–1159 Å was used Wyart (2006, priv. comm.). This spectrum was recorded using a VS in the sliding mode of operation at 200 A current on the NIST 10.7-m normal incidence spec-trograph. The wavelength uncertainty of this spectrum was estimated at ±0.006 Å using the rms of differences between wavelengths of Nd III lines in this spectrum and the spectrum from Troitsk in the range 390–1525 Å. The Troitsk Nd VS spectrum was taken at 1500 A and has a much higher background, many weaker lines were not observed and some lines were also blended with the second-order lines with shorter wavelengths. Therefore, the additional line list of Wyart (2006, priv. comm.) in the range 820–1159 Å was used for wavelength measurements of the 4f35d–4f35f transitions.
Lastly, the list of spectral lines that H. M. Crosswhite had classified as potentially belonging to Nd III in her grating plates can be found in Appendix E of Ding (2024). This line list was unpublished and likely came from her work in Dieke et al. (1961) and Dieke & Crosswhite (1963). Of these lines, 14 corresponded to 4f36p–4f3(7s + 6d) transitions of Nd III as a result of the present work.
3 Empirical spectrum analysis of Nd III
3.1 Methodology
The empirical spectrum analysis of an atom or ion involves assigning upper and lower energy levels, namely, a pair of energies and a pair of J values, to each of its transitions observed in the laboratory. This can be done by matching observed wavelengths of spectral lines with theoretical level energy separations and by matching observed relative intensities of spectral lines with theoretical TPs and expected relative level populations. Such an analysis requires information on the spectrum of atomic transitions to be extracted into line lists by fitting experimental spectra using model line profiles. A line list contains the important parameters for each line, namely the wavenumber and relative intensity and their uncertainties. Other parameters such as S/N and FWHM are also a part of the line lists and these can hint at potential problems with the fitted lines, such as unreliable weak and blended lines.
The matching of intensity patterns and level energy values to find new energy levels can be ambiguous in complex atomic spectra. The number of spurious candidate energy levels increases rapidly with increasing number of lines and increasing experimental and theoretical uncertainties in energies and relative intensities. Extra observational evidence is often required for correct line classifications. The methodology and strategies employed for the analysis of Nd III are discussed in detail in Ding et al. (2024). Compared to the 4f4–4f35d transitions in the visible, the 4f36p–4f3(7s + 6d) transitions were observed under lower S/Ns and larger Doppler widths in the Nd-Ar PDL FT spectra due to shorter wavelengths. Line profiles resulting from isotope shifts and hyperfine structure were not reliably observed for the transitions from the 4f3(7s + 6d) configurations (e.g. see Fig. 1) and so, analysis guidance from isotope line profiles was not available.
3.2 Results
3.2.1 Energy levels
All newly found level energies of the 4f37s and 4f36d configurations were optimised by inputting wavenumbers of 579 Nd III lines fitted from the Nd-Ar PDL FT spectra (Ding et al. 2024) into the computer program LOPT by Kramida (2011), where level energy uncertainties, Ritz wavenumbers, and Ritz wavenumber uncertainties were also estimated. All newly found 4f35f level energies were estimated using transition wavelengths recorded by Wyart (2006, priv. comm.) in the range 820–1159 Å and input into LOPT with the connecting 4f35d levels at fixed energies. The differences between fixing and not fixing the 4f35d level energies are negligible due to the much higher uncertainties of the 4f35d–4f35f grating wavelengths. This fixing of 4f35d levels was chosen as the higher resolution FT measurements used to find the 4f3 5d levels in Ding et al. (2024) are more reliable due to higher wavenumber accuracy and better resolved blends in the FT spectra.
The 116 newly identified energy levels of the 4f37s, 4f36d, and 4f35f configurations of Nd III are included in Table A.1. The extract of Table A.1 shows the lowest-lying levels of these configurations and energy ranges of the table for both parities. Typical energy uncertainties are 0.01 cm−1 for the 4f37s and 4f36d levels and 0.3 cm−1 for the 5f levels. We would like to note that the 4f3(4I°)6d5 H3 level has relatively large energy uncertainty because the two lines observed for this level were blended with other lines in both the Nd–Ar PDL FT and the Nd VS grating spectra. The FWHM of each of the two lines in the FT spectrum was set as their statistical wavenumber uncertainties in the level energy optimisation.
In theoretical calculations, the 4f37s levels were represented very well by the eigenfunctions from jj-coupling the excited electron with the three 4f core electrons in the LS -coupling scheme, similar to the 4f36s levels of Nd III. The mean difference between all observed level energies and those from previous calculations in the literature by Gaigalas et al. (2019) was offset within a few percent (around 6000 cm−1), but the variance in these differences within each configuration was up to two orders of magnitude smaller than the offset.
3.2.2 Classified transitions
In the Nd-Ar PDL FT spectra, 147 of the 4f36p–4f37s and 4f36p–4f36d Nd III transitions were observed, all of which were also observed in the Nd VS spectra and are listed in Table B.1 with the maximum S/N at 37 and an average uncertainty of ±0.024 cm−1. The 39 lines of the 4f36p–f37s and 4f36p–f36d transitions and 169 lines of the 4f35d–4f35f transitions observed only in the Nd VS spectra are also listed in Table B.1. The 39 grating lines originating from the 4f37s and 4f36d configurations were weighted zero in the level energy optimisation process; the wavelength uncertainty of these grating spectra, deduced from rms of deviations from reference wavelengths at ±0.006 Å, is around ±0.1 cm−1 at 40 000 cm−1, which is an order of magnitude higher than the 4f37s and 4f36d level energy uncertainties optimised purely using Nd–Ar FT spectra wavenumbers. Additionally, blends are much more common in the line-rich and lower-resolution Nd VS spectra, and therefore uncertainty improvements in the optimised level energies would not be guaranteed in the inclusion of these grating lines in the level optimisation process. For the 4f35d–4f35f transitions observed only in the Nd VS grating spectra, their wavelength uncertainties of around ± 0.006 Å were used in level optimisation.
We would like to note that the relative intensity measurements in Table B.1 are recommended only as guides (Ding et al. 2024). For the FT spectral lines, we estimate relative intensity uncertainties of at least 20% due to low S/Ns. These are also expected to be larger when comparing lines between FT spectra E and F, primarily due to the different lamp conditions on different days. For the grating spectral lines, the uncertainties are expected to be even more uncertain and relative intensities are recommended to be qualitative as these are the photographic plate darkening calibrated using approximate sensitivity and grating instrumental response curves.
3.3 Analysis and remarks
We discuss the analysis and finding of the new energy levels of this work in this section. We expect most energy levels to be correctly identified and that they will improve current constraints and benchmarks for large-scale Nd III atomic structure calculations. The 5Lº10, 5G°2, and 3G°3A5 levels of the 4f3(4I°)6d configuration were each identified using only one observed transition, caution is advised and they should be more appropriately treated as tentative. For each of these levels, the strongest transition to the 4f36p configuration was observed across both the Nd–Ar PDL FT and Nd VS grating spectra, unobserved in the Nd–Ar HCL spectrum and was the only candidate within ~50 cm−1 of the predicted wavenumber.
3.3.1 Initial Cowan code parameters
Before the experimental investigation of the 4f37s, 4f36d, and 4f35f levels, theoretical atomic structure calculations for these configurations were carried out using the Cowan codes (Cowan 1981; Kramida 2021), as these would guide the process of finding levels. The scaling factors of the 4f36d configurations in these Cowan code calculations were taken as those fitted for the 4f35d configuration. Parameters describing the interactions within the 4f3 sub-shell in the 4f37s and 4f35f configurations were also taken from their empirical ratios determined for the 5d configuration. Lastly, the 4f4–4f37s and 4f4–4f35f interactions were scaled by 0.85 with respect to their corresponding Hartree-Fock values. The Cowan code calculations used for identifying levels of the present work were presented in Ding et al. (2024).
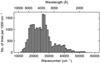 |
Fig. 2 Number of lines per 1000 cm−1 observed in the six Nd-Ar PDL FT spectra. We note that this distribution is largely dependent on the experimental parameters (see Table 2 of Ding et al. 2024), e.g. instrumental response and discharge conditions. |
3.3.2 4f3(4I°)7s and 4f3(4I°)6d levels
All 8 levels of the 4f3(4I°)7s sub-configuration were identified and 38 of the 40 levels of the 4f3(4I°)6d sub-configuration were identified. The 4f36d–4f35f lines are around 8000 Å and calculated to have high TPs, but they lie outside the available sensitive spectral range of the Imperial College VUV FT spectrometer, so the known 4f35f levels could not be used in the search for the unknown 4f36d levels or vice versa.
As the 4f36p configuration of Nd III was only well established for the 4f3(4I°) parent term, only new 4f3(4I°)7s and 4f3(4I°)6d levels were identified in the present work, through classification of the newly observed 4f36p–4f37s and 4f36p– 4f36d transitions. Attempts for these classifications were not successful using only the Nd-Ar PDL FT spectra and theoretical calculations from Gaigalas et al. (2019), where the 4f37s and 4f36d levels were predicted to have energies around 6000 cm−1 higher than their eventually observed values. Confident classifications of the transitions were first made in the Nd VS spectra, followed by confirmations with corresponding weak but more wavelength-accurate lines in the Nd-Ar PDL FT spectra. This initial progress improved the Cowan code parameter constraints and provided expectations for similar relative intensities in the FT and grating spectra for the other 4f36p-4f37s and 4f36p–4f36d transitions.
The two UV Nd–Ar PDL FT spectra contain only 3451 of the 21584 lines fitted in total from all six spectra measured across the spectral range 11 500–54000 cm−1 (8695–1852 Å) in Ding et al. (2024). The line densities across the spectral range are illustrated in Fig. 2. Compared to classifying the 4f4–4f35d transitions in the visible region, the lower line density and fewer number of blended lines above ~30 000 cm−1 produced very few ambiguous classifications for the 4f35d–4f36p, 4f36s–4f36p, 4f36p–4f37s, and 4f36p–4f36d transitions predicted (Gaigalas et al. 2019; Ding et al. 2024) to lie within this region. While the 4f35d–4f36p and 4f36s–4f36p transitions were relatively straightforwardly classified in Ding et al. (2024), this was far more challenging for many 4f36p–4f37s and 4f36p–4f36d transitions; the strongest lines of these four transition arrays have similar predicted TPs, but the 7s and 6d levels lie about 40 000 cm−1 higher than the 6p levels. Therefore, due to lower level populations of the 4f37s and 4f36d levels, fewer 4f36p–4f37s and 4f36p– 4f3 6d transitions were observed and were observed at lower S/Ns compared to the 4f35d–4f36p and 4f36s–4f36p transitions in the Nd–Ar PDL FT spectra. The reduction in line S/Ns and in the number of lines observed from each energy level increased the number of ambiguous classifications; hence, many 4f37s and 4f3 6d levels could not be identified without the Nd VS grating spectra containing the weaker lines, especially in cases when only one line of a 4f36d level was expected to be observable in the Nd–Ar PDL FT spectra.
In contrast, the number of lines measured in the Nd VS grating spectra between 1921 and 3250 Å was around 9000 and these were recorded under spectral resolving powers around one order of magnitude lower than those in the Nd–Ar FT spectra, where blended lines were expected to be very common at this line density. However, due to the much higher discharge currents, many 4f36p–4f37s and 4f36p–4f36d transitions were observed and their levels were confidently identified solely using the Nd VS grating spectra, which were later found to be consistent with the lines observed near the noise level in the Nd–Ar PDL FT spectra. Nevertheless, it was not possible to find the 4f37s and 4f36d levels with only a few transitions to known levels without corroboration with the Nd–Ar PDL FT spectra; for instance, many incorrect candidate lines were not observed or observed at unlikely relative intensities in the Nd–Ar PDL FT spectra.
3.3.3 4f35f levels
Based on the classification of 169 lines of the 4f35d–4f35f transitions, 70 levels of the 5f configuration were found, containing all 56 levels of the 4f3(4I°)5f sub-configuration and 14 levels of the 4f3(4F°)5f and 4f3(2H2°)5f sub-configurations. Transitions involving the 4f35f levels were not observed in the Nd–Ar PDL FT spectra. As was mentioned previously, the wavelengths and intensities of the 4f35d–4f35f transitions were taken from the line list of Wyart (2006, priv. comm.) in the range 820–1159 Å. Only lines with intensities greater than 10 on this line list scale were also definitely present in the Troitsk spectra. However, the intensity differences between the line lists of Wyart (2006, priv. comm.) and Troitsk (of spectra recorded at two different spark currents) were used to aid classifications of lines belonging to Nd III.
3.3.4 Additional low-lying levels identified in stellar spectra
One level of the 4f4 configuration and three levels of the 4f35d configuration have been newly identified based on the fitting of calculated line intensities and Zeeman patterns to the absorption line profiles in stellar spectra described in Ding et al. (2024). The 4f4 3H44 and 4f3(2H2°)5d 3H°4,6 levels were first identified only using stellar spectra, with corresponding lines later confirmed in the Nd–Ar PDL FT spectra that were then used in their level energy optimisations. All 13 observed and classified spectral lines of these three levels are included as the final rows of Table B.1. Notably, the 4f4 3H44–lf3(2H2°)5d 3H°4 transition was deduced purely from its stellar Zeeman pattern and primarily enabled the identification of its two levels. Transitions of 4f3(2H2°)5d 3H°6 are much lower in S/N but are observed at wavenumbers consistent with optimised energies of the known levels, as well as at expected line intensities.
The 4f3(2H2°)5d 3F°4 level energy was estimated at 34742.15 ± 0.10 cm−1, using only two stellar absorption lines. Two transitions from 4f3(2H2°)5d 3F°4 to known levels 4f4 5F5 (4642.97 Å, the stronger line) and 4f4 3H45 (5517.27 Å, the weaker line) were found in stellar spectra, their fits are shown in Fig. 3. The stronger transition is the only transition observed in the Nd–Ar FT spectra, but appeared blended in both the PDL and HCL spectra.
Configuration interaction space for the 4f3(4f, 5f, 5d, 6d, and 6p) (case 1) and 4f3(7s + 6d) (case 2) singly excited configurations of Nd III.
4 New Nd III atomic structure and transition probability calculations
As the experimental energy level and spectrum analysis of Nd III concluded, final semi-empirical Cowan code calculations of Nd III fine structure and TPs were carried out. Results from these calculations are presented in this section.
4.1 Cowan code parameters
The previous analysis of Nd III (Ding et al. 2024) did not include configurations involving the excitation of a 5p electron of the 5p6 core, where underestimations of the experimental lifetimes of five levels of Nd III (Zhang et al. 2002) were evident. Configuration interactions involving these 5p-excited configurations have been shown to significantly increase calculated level lifetimes of Nd IV (Wyart et al. 2007; Arab et al. 2019) and Nd V (Meftah et al. 2008; Deghiche et al. 2015). To account for this in Nd III and to check the consistency of our energy level identifications, new semi-empirical calculations for Nd III were carried out using the Cowan code (e.g. Cowan 1981; Kramida 2021) in the present work. The calculations presented here were carried out after the identification of all Nd III 4f3(7s, 6d, and 5f) energy levels of this work.
Including all known configurations of Nd III and significant 5p-excited configurations of Nd III led to prohibitively large Hamiltonian matrix dimensions for our computational resources. Therefore, we included only the most significant configuration interactions of the 5p-excited configurations with the previously known and newly established energy levels, these are 5p64f4 ↔ 5p54f5 and 5p64f36p ↔ 5p54f46p for the even parity, and 5p64f35d ↔ 5p54f45d, 5p64f36s ↔ 5p54f46s, 5p64f37s ↔ 5p54f47s, and 5p64f36d ↔ 5p54f46d for the odd parity. Separate configuration interaction spaces were used in calculations for the 4f3(4f, 5f, 5d, 6s, and 6p) configurations (case 1) and 4f3(7s + 6d) configurations (case 2). These two cases are presented in Table 1, where the aforementioned significant configuration interactions are indicated in parentheses. Cowan code energy parameters for the 4f3(7s, 6d, and 5f) configurations are listed in Table C.1. Configuration interaction parameters, and parameters of other configurations of Table 1 are available in the full version of Table C.1 at Zenodo. All Slater and configuration interaction parameters of the 5p-excited configurations were fixed at 0.85 and 0.7 of their ab initio HFR values, respectively. The calculated energy levels are presented in Table A.1, but levels predicted in the odd system with energies between 47 500 and 103 085 cm−1 are not included. This is because they are expected to be very uncertain due to the lack of known levels in this energy range in the odd parity.
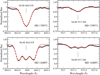 |
Fig. 3 Observed (black filled circles) and synthesised (red line) spectral lines of the newly identified 4f3(2H2°)5d 3F°4 level in spectra of HD 170973 and HD 144893 with surface magnetic fields 〈Bs〉<1 kG and 〈Bs〉=8.8 kG, respectively, showing two newly classified, previously unknown transitions of Nd III: 4f4 5F5–4f3(2H2°)5d 3F°4 within 4642.6–4643.4 Å and 4f4 3H45–4f3(2H2°)5d 3F°4 within 5516.9–5517.7 Å. Wavelengths are given as air values. |
4.2 Transition probabilities and energy level lifetimes
The calculated TPs are presented in Table D.1. The wavelength range (1900–50000 Å) is selected for the applicability of the data in vacuum UV and mid-IR spectroscopic studies. Based on line strength significance and accuracy, the range of transitions presented is as follows: 1900–50000 Å and 𝑔uA > 103 s−1 for transitions of the 4f3(4f, 5d, 6s, and 6p) configurations with even parity level energies below 131 000 cm−1 and odd parity below 47 500 cm−1 (calculated under case 1 of Table 1), 2060–2950 Å and 𝑔uA > 103 s−1 for transitions with upper levels from the 4f3(7s + 6d) configurations with even parity level energies below 80 700 cm−1 and odd parity level energies within 103 000–112000 cm−1 (calculated under case 2 of Table 1), and 3700–30000 Å and 𝑔uA > 104 s−1 for transitions with lower levels from the 4f3(7s + 6d) configurations with even parity level energies below 131 000 cm−1 and odd parity level energies within 103 000–112000 cm−1 (calculated under case 2 of Table 1).
The uncertainties in the calculated TPs and branching ratios are indicative from the cancellation factors (Cowan 1981) in Table D.1. Smaller cancellation factors indicate larger uncertainties due to larger destructive interference in the summations of the dipole matrix element evaluation. For context, around 90% of the transitions of Nd III observed in the laboratory are calculated to have cancellation factors greater than 0.05. The calculated branching ratios of these lines were compared with their experimental relative intensities in their classifications (Ding et al. 2024).
Level lifetimes of the 4f35d configuration calculated in the present work from additionally considering 5p-excited configurations are on average 60% larger compared to those calculated in Ding et al. (2024). This improved the mean ratio between the five experimental lifetimes measured by Zhang et al. (2002) and their calculated values from 1.4 to 0.9. However, the root-mean-square deviation from the five experimental values increased from 61 to 88 ns. Furthermore, the changes in lifetime for levels of other configurations (not 4f35d) were less than 10% when 5p-excited configuration interactions of the present work are included, indicated by transitions with guA > 107 s−1. To reduce computational complexity, the 5p64f35f ↔ 5p54f45f configuration interaction was not included due to negligible changes observed for the 4f35f lifetimes when included. We expect more lifetime measurements for Nd III levels to be required to conclude whether the present lifetime calculations provide improvements compared to those made in Ding et al. (2024).
We would also like to note that the lifetimes calculated in the present work in Table A.1 are only from electric dipole (E1) transitions, so lifetimes are not listed for levels with no lower level of opposite parity or J value within ±1, for instance, the lowest-lying 4f4 levels labelled with 5I, 5F, and 3K2 terms.
4.3 Implications for the Nd III energy level analysis
The implications of the new calculations including 5p-excited configuration interactions on all experimental identification of Nd III energy levels were investigated. The lowest levels of the 5p-excited configurations were estimated to lie several 10000 cm−1 above the highest-lying known level. Therefore, changes to eigenvector compositions and branching fractions of known levels were very small. None of the five leading eigenvector components of the levels of Table A.1 belong to the 5p-excited configurations. Experimental energy level identifications using calculations without 5p-excited configuration interactions (Table A.1 and Ding et al. 2024) agree with calculations from the present work including 5p-excited configuration interactions. In a few cases, branching fractions obtained in the new calculations with 5p-excited configuration interactions agreed better with experimental relative intensities. Only two of the highest-lying 4f36p levels reported in Ding et al. (2024), 77 231.115 cm−1 J = 5 and 80 593.604 cm−1 J = 6, are now considered uncertain and tentative due to results of the new calculations. This does not affect the optimised energies of other levels as the energies of these two levels are defined by one line each.
5 Revision of Nd III ionisation energy
The ionisation energy of Nd III is the energy separation between the 4f4 5I4 ground energy level of Nd III and the 4f3 4I°9/2 ground energy level of Nd IV, which can be estimated when the four levels of the 4f3(4I°9/2)6s and 4f3(44f3(4I°9/2)7s sub-configurations of Nd III are known (Sugar & Reader 1973). The method is based on solving the equation of the difference between the center-of-gravity (COG) binding energies of the 4f36s and 4f37s configurations using the Rydberg-Ritz formula,
![Mathematical equation: $\Delta T = {{{R_{{\rm{Nd}}}}Z_{\rm{C}}^2} \over {{{\left[ {{n^*}(6{\rm{s}})} \right]}^2}}} - {{{R_{{\rm{Nd}}}}Z_{\rm{C}}^2} \over {{{\left[ {{n^*}(6{\rm{s}}) + \Delta {n^*}(7{\rm{s}} - 6{\rm{s}})} \right]}^2}}},$](/articles/aa/full_html/2024/12/aa51652-24/aa51652-24-eq1.png) (1)
(1)
where RNd = 109 736.9 cm−1 is the Nd Rydberg constant determined using standard formulae and Nd relative atomic mass (Prohaska et al. 2022), ZC = 3 is the Nd III core charge, n*(ns) is the effective quantum number of the configuration ns, and ∆n*(7s − 6s) = n*(7s) − n*(6s). The ∆T of Nd III, defined for the full 6s and 7s configurations, is well represented by the difference between COG energies of the lowest-lying terms of the 4f3(4I°9/2)6s and 4f3(4I°9/2)7s sub-configurations (Sugar & Reader 1965; Reader & Sugar 1966; Sugar & Reader 1973). Thus, with knowledge of the quantities ∆T and ∆n*(7s − 6s), n*(6s) and the COG binding energy of 4f3(4I°9/2)6s is solved. This COG binding energy is added to the known COG energy of 4f3(4I°9/2)6s relative to the ground state energy to yield the ionisation energy.
In 1973, the COG energies of the 4f3(4I°9/2)6s and 4f3 (4I°9/2)7s sub-configurations were unknown. These quantities, as well as ∆n*(7s − 6s), were interpolated by Sugar & Reader (1973) from studies of some second and third spectra of the lanthanide atoms. With the accepted quantity ∆n*(7s − 6s) = 1.048 ± 0.002, the ionisation energy was estimated in 1973 as 178 600 ± 2400 cm−1.
More recently, Johnson & Nelson (2017b) updated the Nd III ionisation energy to be 178 140 ± 600 cm−1 using a framework of the method by Sugar & Reader (1973). The levels of the 4f3(4I°9/2)6s and 4f3(4I°9/2)7s sub-configurations were still unknown. However, improved interpolated values of ∆T and ∆n*(7s − 6s) were obtained from the availability of new data since 1973 for the other neighbouring ions.
In Ding et al. (2024) and the present work, the COG energies of the 4f3(4I°9/2)6s and 4f3(4I°9/2)7s sub-configurations were determined at 30269 cm−1 and 103 223 cm−1 respectively, this corresponds to ∆T = 72 954 cm−1 and has now permitted a further update of the Nd III ionisation energy. Together with the estimated value of ∆n*(7s − 6s) = 1.0476 ± 0.0052 by Johnson & Nelson (2017b), 2.5850 is now obtained for n*(6s). As a result, the ionisation energy of Nd III is estimated to be 178 070 ± 330 cm−1, in close agreement with Johnson & Nelson (2017b) but with about two times higher level of accuracy. The uncertainty ± 330 cm−1 is at two standard deviations and is fully determined by the ±0.0052 uncertainty of the ∆n*(7s − 6s) value estimated by Johnson & Nelson (2017a).
6 Conclusions
This work is a conclusion to our Nd III energy level and spectrum analysis using experimental spectra of Nd detailed in Ding et al. (2024), the Nd grating line list from Wyart (2006, priv. comm.), and Crosswhite’s unpublished Nd III line lists. Continued analysis of Nd III using these experimental data is proving to be challenging. For example, a handful of strong Nd III lines between unknown levels are likely observed, but the weaker lines that can connect levels of these strong lines to the known level network are low in S/N and have ambiguous classifications. Further investigations on Nd III atomic structure should consider new experiments (e.g. designed to observe key transitions at higher S/Ns) and extensions of the semi-empirical atomic structure and TP calculations of this work. Next steps could involve investigating the doubly excited configurations or using Ne as the carrier gas in the PDL to potentially better populate levels of the 4f35d configuration (Ding 2024). With the significant advancement in experimental knowledge of Nd III energy levels, extensive TP measurements and stellar spectroscopy of this ion is now enabled, which could also be guided by our semi-empirical level lifetime and TP calculations. We presented our predictions for Nd III transitions across the 1900-50 000 Å wavelength range, these include only transitions expected to have reasonably accurate wavelengths (~1% error or less) and sufficient TPs for their spectral lines to be potentially observable.
In total, 985 transitions and 264 energy levels of Nd III are now observed and measured accurate to a few parts in 108, and 355 of the transitions belong to the 116 new energy levels of the 4f3(7s, 6d, and 5f) configurations determined in the present work for the first time. Four additional previously unknown low-lying levels of the 4f3(4f, 5d) configurations have also been identified. The number of known Ritz wavelengths of transitions between all 264 known energy levels of Nd III is of order 104, including transitions of the lowest TPs (i.e. excluded by Table D.1), which is about one or two orders of magnitude lower than the number of transitions predicted by atomic structure models used for kilonova opacity investigations (e.g. Kasen et al. 2013; Gaigalas et al. 2019; Silva et al. 2022; Flörs et al. 2023). The primary reason for this is that many predicted configurations and levels remain experimentally unconfirmed due to low TPs and low level populations in the laboratory plasmas and stars. This is evident from the gap between the highest-lying known level of Nd III at 130 594.8 cm−1 and its ionisation energy, which is now more accurately determined at 178 070 ± 330 cm−1. Therefore, investigating Nd III kilonova opacity contributions still requires significant theoretical supplementation.
Overall, we expect experimental energy level and spectrum analyses to be indispensable in addressing atomic data limitations for kilonovae spectral synthesis. Firstly, the strongest transitions contributing largely to characteristic absorption features of kilonovae spectra are measurable with negligible wavelength uncertainties. Secondly, improving atomic structure models using experimental knowledge should be key. For example, without knowing energies of the 4f3(7s, 6d, and 5f) levels found in this work, their UV transitions were calculated to be 6000 cm−1 above their observed values (Gaigalas et al. 2019). This is a difference of around 40 nm at 250 nm and also significant in their TPs that are proportional to wavelength cubed.
The results presented in this work and in Ding et al. (2024) demonstrate the capabilities of modern laboratory spectroscopy in the empirical determination of complex lanthanide atomic structure. Similar experimental methods are expected to be applicable in deducing hundreds (if not thousands) of energy levels in many other neutral, singly and doubly ionised lanthanide species.
Data availability
Tables A.1, B.1, C.1, and D.1 are available at https://doi.org/10.5281/zenodo.13961142.
Acknowledgements
This work was supported at Imperial College by the STFC of the UK (grant numbers ST/S000372/1, ST/N000838/1, and ST/W000989/1), the Bequest of Prof. Edward Steers, and at the Institute of Spectroscopy of the Russian Academy of Sciences by the research project FFUU-2022-0005. We are grateful to Prof. C. R. Cowley for sharing the unpublished Nd III line lists of the late Dr H. M. Crosswhite. We also thank Prof. W.-Ü. Tchang-Brillet and the late Dr J.-F. Wyart for providing the Nd vacuum sliding spark grating plates recorded at NIST, and we acknowledge Dr N. Spector and Dr J. Sugar for the recording of these plates.
Appendix A Empirically identified and calculated energy levels of Nd III
Energy levels experimentally established and semi-empirically calculated for Nd III (extract).
Appendix B Transitions of Nd III newly classified in the laboratory
Classified transitions originating from the 4f3(5d, 7s, 6d, and 5f) configurations of Nd III observed in the Nd-Ar PDL FT and Nd VS spectra (extract).
Appendix C Nd III Cowan code parameters
Parameters of the least-squares fit of energy levels of the 4f37s, 4f36d, and 4f35f configurations of Nd III in the Cowan codes (extract).
Appendix D Predicted transitions and transition probabilities of Nd III
References
- Abbott, B. P., Abbott, R., Abbott, T., et al. 2017, Phys. Rev. Lett., 119, 161101 [CrossRef] [Google Scholar]
- Aldenius, M. 2001, Master’s thesis, University of Lund, Sweden [Google Scholar]
- Arab, K., Deghiche, D., Meftah, A., et al. 2019, JQSRT, 229, 145 [NASA ADS] [CrossRef] [Google Scholar]
- Blaise, J., Wyart, J.-F., Hoekstra, R., & Kruiver, P. 1971, JOSA, 61, 1335 [NASA ADS] [CrossRef] [Google Scholar]
- Blaise, J., Wyart, J.-F., Djerad, M. T., & Ahmed, Z. B. 1984, PhyS, 29, 119 [NASA ADS] [Google Scholar]
- Brethauer, D., Kasen, D., Margutti, R., & Chornock, R. 2024, ApJ, 975, 213 [NASA ADS] [CrossRef] [Google Scholar]
- Cowan, R. D. 1981, The Theory of Atomic Structure and Spectra (University of California Press) [Google Scholar]
- Cowan, J. J., Sneden, C., Lawler, J. E., et al. 2021, RMP, 93, 015002 [CrossRef] [Google Scholar]
- Cowley, C. R., Ryabchikova, T., Kupka, F., et al. 2000, MNRAS, 317, 299 [NASA ADS] [CrossRef] [Google Scholar]
- Deghiche, D., Meftah, A., Wyart, J.-F., et al. 2015, Physica Scripta, 90, 095402 [NASA ADS] [CrossRef] [Google Scholar]
- Dieke, G., & Crosswhite, H. 1963, Appl. Opt., 2, 675 [NASA ADS] [CrossRef] [Google Scholar]
- Dieke, G., Crosswhite, H., & Dunn, B. 1961, JOSA, 51, 820 [NASA ADS] [CrossRef] [Google Scholar]
- Ding, M. 2024, PhD thesis, Imperial College London, UK [Google Scholar]
- Ding, M., Ryabtsev, A. N., Kononov, E. Y., et al. 2024, A&A, 684, A149 [NASA ADS] [CrossRef] [EDP Sciences] [Google Scholar]
- Domoto, N., Tanaka, M., Kato, D., et al. 2022, ApJ, 939, 8 [NASA ADS] [CrossRef] [Google Scholar]
- Even, W., Korobkin, O., Fryer, C. L., et al. 2020, ApJ, 899, 24 [NASA ADS] [CrossRef] [Google Scholar]
- Finley, D. S., Bowyer, S., Paresce, F., & Malina, R. F. 1979, Appl. Opt., 18, 649 [NASA ADS] [CrossRef] [Google Scholar]
- Flörs, A., Silva, R. F., Deprince, J., et al. 2023, MNRAS, 524, 3083 [CrossRef] [Google Scholar]
- Fontes, C., Fryer, C., Hungerford, A., Wollaeger, R., & Korobkin, O. 2020, MNRAS, 493, 4143 [CrossRef] [Google Scholar]
- Gaigalas, G., Kato, D., Rynkun, P., Radžiute, L., & Tanaka, M. 2019, ApJS, 240, 29 [NASA ADS] [CrossRef] [Google Scholar]
- Heise, C., Hollandt, J., Kling, R., Kock, M., & Kühne, M. 1994, Appl. Opt., 33, 5111 [NASA ADS] [CrossRef] [Google Scholar]
- Johnson, D. A., & Nelson, P. G. 2017a, JPCRD, 46, 013108 [NASA ADS] [Google Scholar]
- Johnson, D. A., & Nelson, P. G. 2017b, JPCRD, 46, 013109 [NASA ADS] [Google Scholar]
- Kasen, D., Badnell, N., & Barnes, J. 2013, ApJ, 774, 25 [NASA ADS] [CrossRef] [Google Scholar]
- Kramida, A. 2011, CoPhC, 182, 419 [NASA ADS] [Google Scholar]
- Kramida, A. 2021, A Suite of Atomic Structure Codes Originally Developed by RD Cowan Adapted for Windows-based Personal Computers (Gaithersburg, MD, USA: National Institute of Standards and Technology) [Google Scholar]
- Kramida, A., Ralchenko, Y., Reader, J., & the NIST ASD Team 2023, NIST Atomic Spectra Database (version 5.11) (Gaithersburg, MD: National Institute of Standards and Technology) [Google Scholar]
- Learner, R., & Thorne, A. 1988, JOSAB, 5, 2045 [NASA ADS] [CrossRef] [Google Scholar]
- Martin, W. C., Zalubas, R., & Hagan, L. 1978, Atomic Energy Levels – The Rare-Earth Elements (U.S.: Nat. Bur. Stand.), 422 [Google Scholar]
- Meftah, A., Wyart, J.-F., Sinzelle, J., et al. 2008, Physica Scripta, 77, 055302 [NASA ADS] [CrossRef] [Google Scholar]
- Peck, E. R., & Reeder, K. 1972, JOSA, 62, 958 [NASA ADS] [CrossRef] [Google Scholar]
- Prohaska, T., Irrgeher, J., Benefield, J., et al. 2022, Pure App. Chem., 94, 573 [CrossRef] [Google Scholar]
- Przybylski, A. 1977, MNRAS, 178, 71 [NASA ADS] [CrossRef] [Google Scholar]
- Reader, J., & Sugar, J. 1966, JOSA, 56, 1189 [NASA ADS] [CrossRef] [Google Scholar]
- Ryabchikova, T., Ryabtsev, A., Kochukhov, O., & Bagnulo, S. 2006, A&A, 456, 329 [NASA ADS] [CrossRef] [EDP Sciences] [Google Scholar]
- Ryabchikova, T., Sachkov, M., Weiss, W., et al. 2007, A&A, 462, 1103 [NASA ADS] [CrossRef] [EDP Sciences] [Google Scholar]
- Saloman, E. B. 2010, JPCRD, 39, 033101 [NASA ADS] [Google Scholar]
- Savanov, I., Malanushenko, V., & Ryabchikova, T. 1999, Astron. Lett., 25, 802 [NASA ADS] [Google Scholar]
- Silva, R. F., Sampaio, J. M., Amaro, P., et al. 2022, Atoms, 10, 18 [NASA ADS] [CrossRef] [Google Scholar]
- Smartt, S., Chen, T.-W., Jerkstrand, A., et al. 2017, Nature, 551, 75 [NASA ADS] [CrossRef] [Google Scholar]
- Sugar, J., & Reader, J. 1965, JOSA, 55, 1286 [NASA ADS] [CrossRef] [Google Scholar]
- Sugar, J., & Reader, J. 1973, JChPh, 59, 2083 [NASA ADS] [Google Scholar]
- Tanaka, M., & Hotokezaka, K. 2013, ApJ, 775, 113 [NASA ADS] [CrossRef] [Google Scholar]
- Tanaka, M., Kato, D., Gaigalas, G., et al. 2018, ApJ, 852, 109 [NASA ADS] [CrossRef] [Google Scholar]
- Tanaka, M., Kato, D., Gaigalas, G., & Kawaguchi, K. 2020, MNRAS, 496, 1369 [NASA ADS] [CrossRef] [Google Scholar]
- Thorne, A., Harris, C., Wynne-Jones, I., Learner, R., & Cox, G. 1987, JPhE, 20, 54 [NASA ADS] [Google Scholar]
- Watson, D., Hansen, C. J., Selsing, J., et al. 2019, Nature, 574, 497 [NASA ADS] [CrossRef] [Google Scholar]
- Whaling, W., Anderson, W., Carle, M., Brault, J., & Zarem, H. 1995, J. Quant. Spec. Radiat. Transf., 53, 1 [NASA ADS] [CrossRef] [Google Scholar]
- Wyart, J.-F., Meftah, A., Tchang-Brillet, W.-Ü. L., et al. 2007, JPhB, 40, 3957 [NASA ADS] [Google Scholar]
- Zhang, Z., Svanberg, S., Palmeri, P., Quinet, P., & Biémont, E. 2002, A&A, 385, 724 [NASA ADS] [CrossRef] [EDP Sciences] [Google Scholar]
All Tables
Configuration interaction space for the 4f3(4f, 5f, 5d, 6d, and 6p) (case 1) and 4f3(7s + 6d) (case 2) singly excited configurations of Nd III.
Energy levels experimentally established and semi-empirically calculated for Nd III (extract).
Classified transitions originating from the 4f3(5d, 7s, 6d, and 5f) configurations of Nd III observed in the Nd-Ar PDL FT and Nd VS spectra (extract).
Parameters of the least-squares fit of energy levels of the 4f37s, 4f36d, and 4f35f configurations of Nd III in the Cowan codes (extract).
All Figures
|
Fig. 1 Section of the Nd-Ar PDL FT spectrum (solid line) containing many 4f36p–4f3(7s + 6d) transitions in its neighbourhood. The corresponding section of the Nd-Ar HCL spectrum is shown using the dash-dotted line. Six 4f36p–4f36d transitions of Nd III are marked, the two Ar lines were classified by comparison with observed lines of Saloman (2010); Kramida et al. (2023). The wavenumber of this section is above all Ritz wavenumbers of allowed E1 transitions between known energy levels of Nd I-II (Blaise et al. 1971, 1984; Martin et al. 1978; Kramida et al. 2023), and no classified Nd IV transitions (Wyart et al. 2007; Deghiche et al. 2015) matched the lines marked as ‘U’. Wavelengths and wavenumbers are given as vacuum values. |
| In the text | |
|
Fig. 2 Number of lines per 1000 cm−1 observed in the six Nd-Ar PDL FT spectra. We note that this distribution is largely dependent on the experimental parameters (see Table 2 of Ding et al. 2024), e.g. instrumental response and discharge conditions. |
| In the text | |
|
Fig. 3 Observed (black filled circles) and synthesised (red line) spectral lines of the newly identified 4f3(2H2°)5d 3F°4 level in spectra of HD 170973 and HD 144893 with surface magnetic fields 〈Bs〉<1 kG and 〈Bs〉=8.8 kG, respectively, showing two newly classified, previously unknown transitions of Nd III: 4f4 5F5–4f3(2H2°)5d 3F°4 within 4642.6–4643.4 Å and 4f4 3H45–4f3(2H2°)5d 3F°4 within 5516.9–5517.7 Å. Wavelengths are given as air values. |
| In the text | |
Current usage metrics show cumulative count of Article Views (full-text article views including HTML views, PDF and ePub downloads, according to the available data) and Abstracts Views on Vision4Press platform.
Data correspond to usage on the plateform after 2015. The current usage metrics is available 48-96 hours after online publication and is updated daily on week days.
Initial download of the metrics may take a while.