Fig. 7.
Download original image
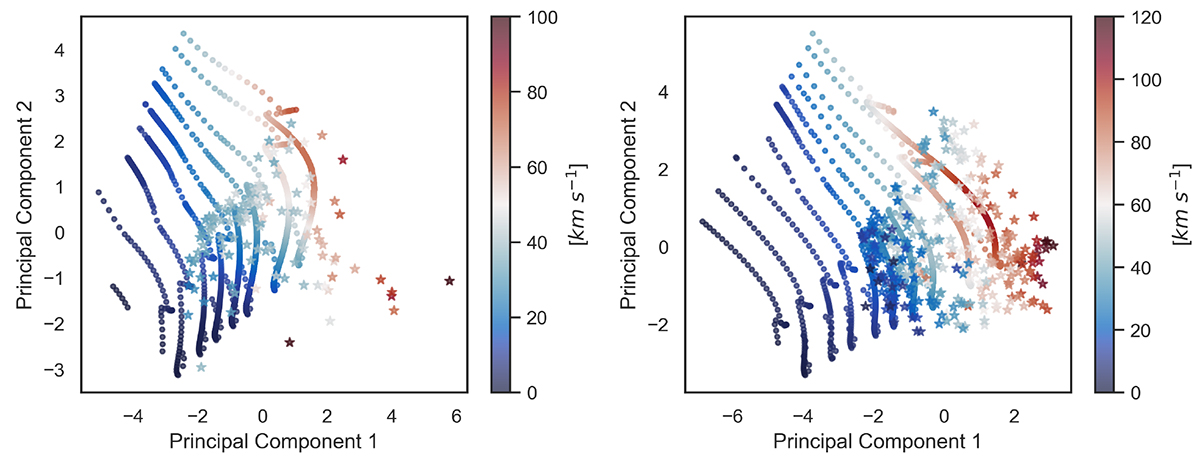
Projection of datasets on the principal components space. Left panel: Models with Z = 0.006 (circles) and observed LMC sample (stars). Right panel: Models with Z = 0.014 (circles) and observed Galactic sample (stars). The colours show the convective velocity for the model data and the macroturbulent velocities for the observed data. All four datasets were analysed independently.
Current usage metrics show cumulative count of Article Views (full-text article views including HTML views, PDF and ePub downloads, according to the available data) and Abstracts Views on Vision4Press platform.
Data correspond to usage on the plateform after 2015. The current usage metrics is available 48-96 hours after online publication and is updated daily on week days.
Initial download of the metrics may take a while.