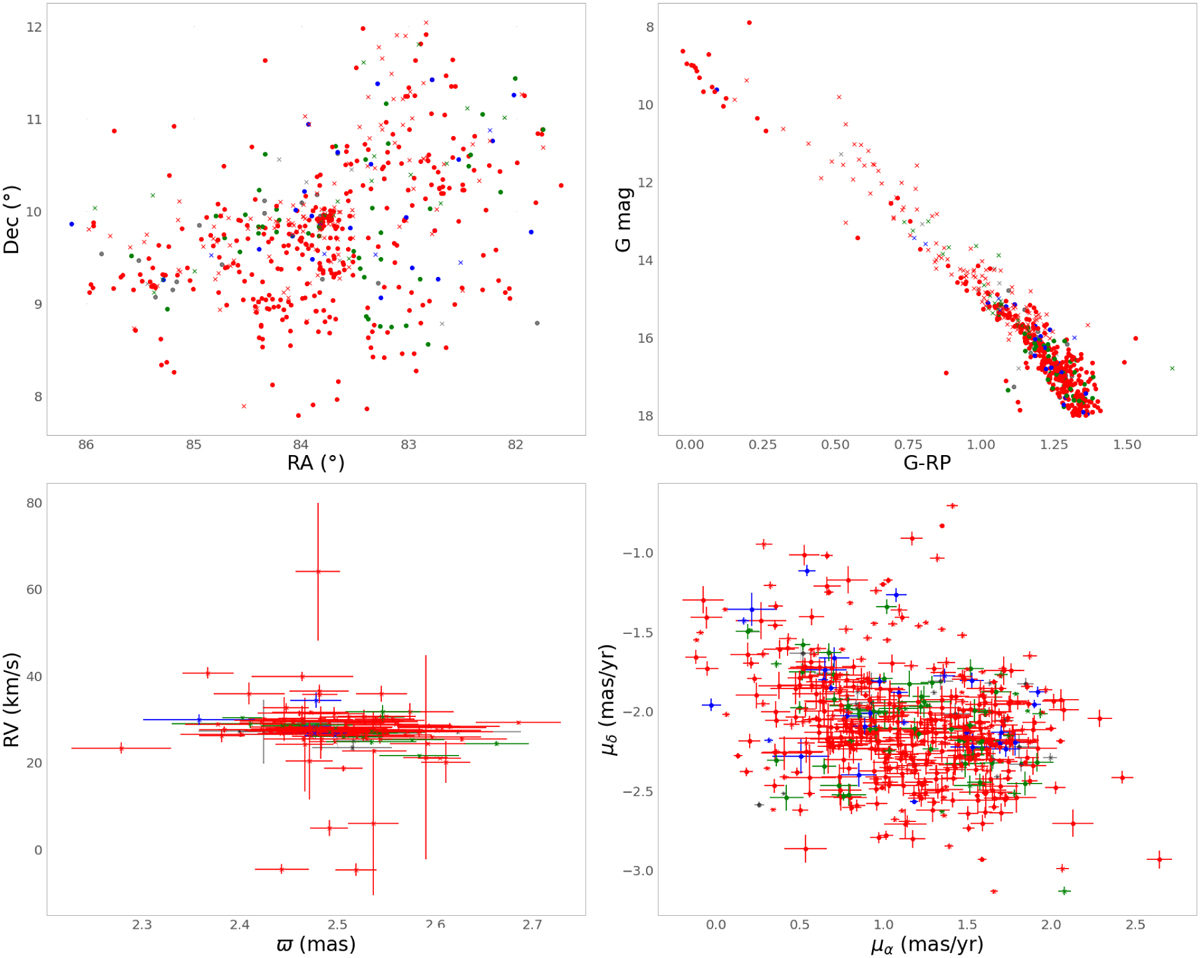
Fig. 2
Download original image
Gaia data of cluster members. (a) Top left: sky positions of cluster members of λ Ori from Cantat-Gaudin et al. (2020). Here, sources with a membership probability of 1.0 are plotted in red, 0.9 in green, 0.8 in blue, and 0.7 in grey. Sources with RVs from Tsantaki et al. (2022) are plotted as crosses. (b) Top right: Gaia EDR3 BP-RP versus Gmag colour-magnitude diagram. (c) Bottom left: Gaia EDR3 parallax versus RV. (d) Bottom right: Gaia EDR3 proper motions of the sources.
Current usage metrics show cumulative count of Article Views (full-text article views including HTML views, PDF and ePub downloads, according to the available data) and Abstracts Views on Vision4Press platform.
Data correspond to usage on the plateform after 2015. The current usage metrics is available 48-96 hours after online publication and is updated daily on week days.
Initial download of the metrics may take a while.