Fig. 16
Download original image
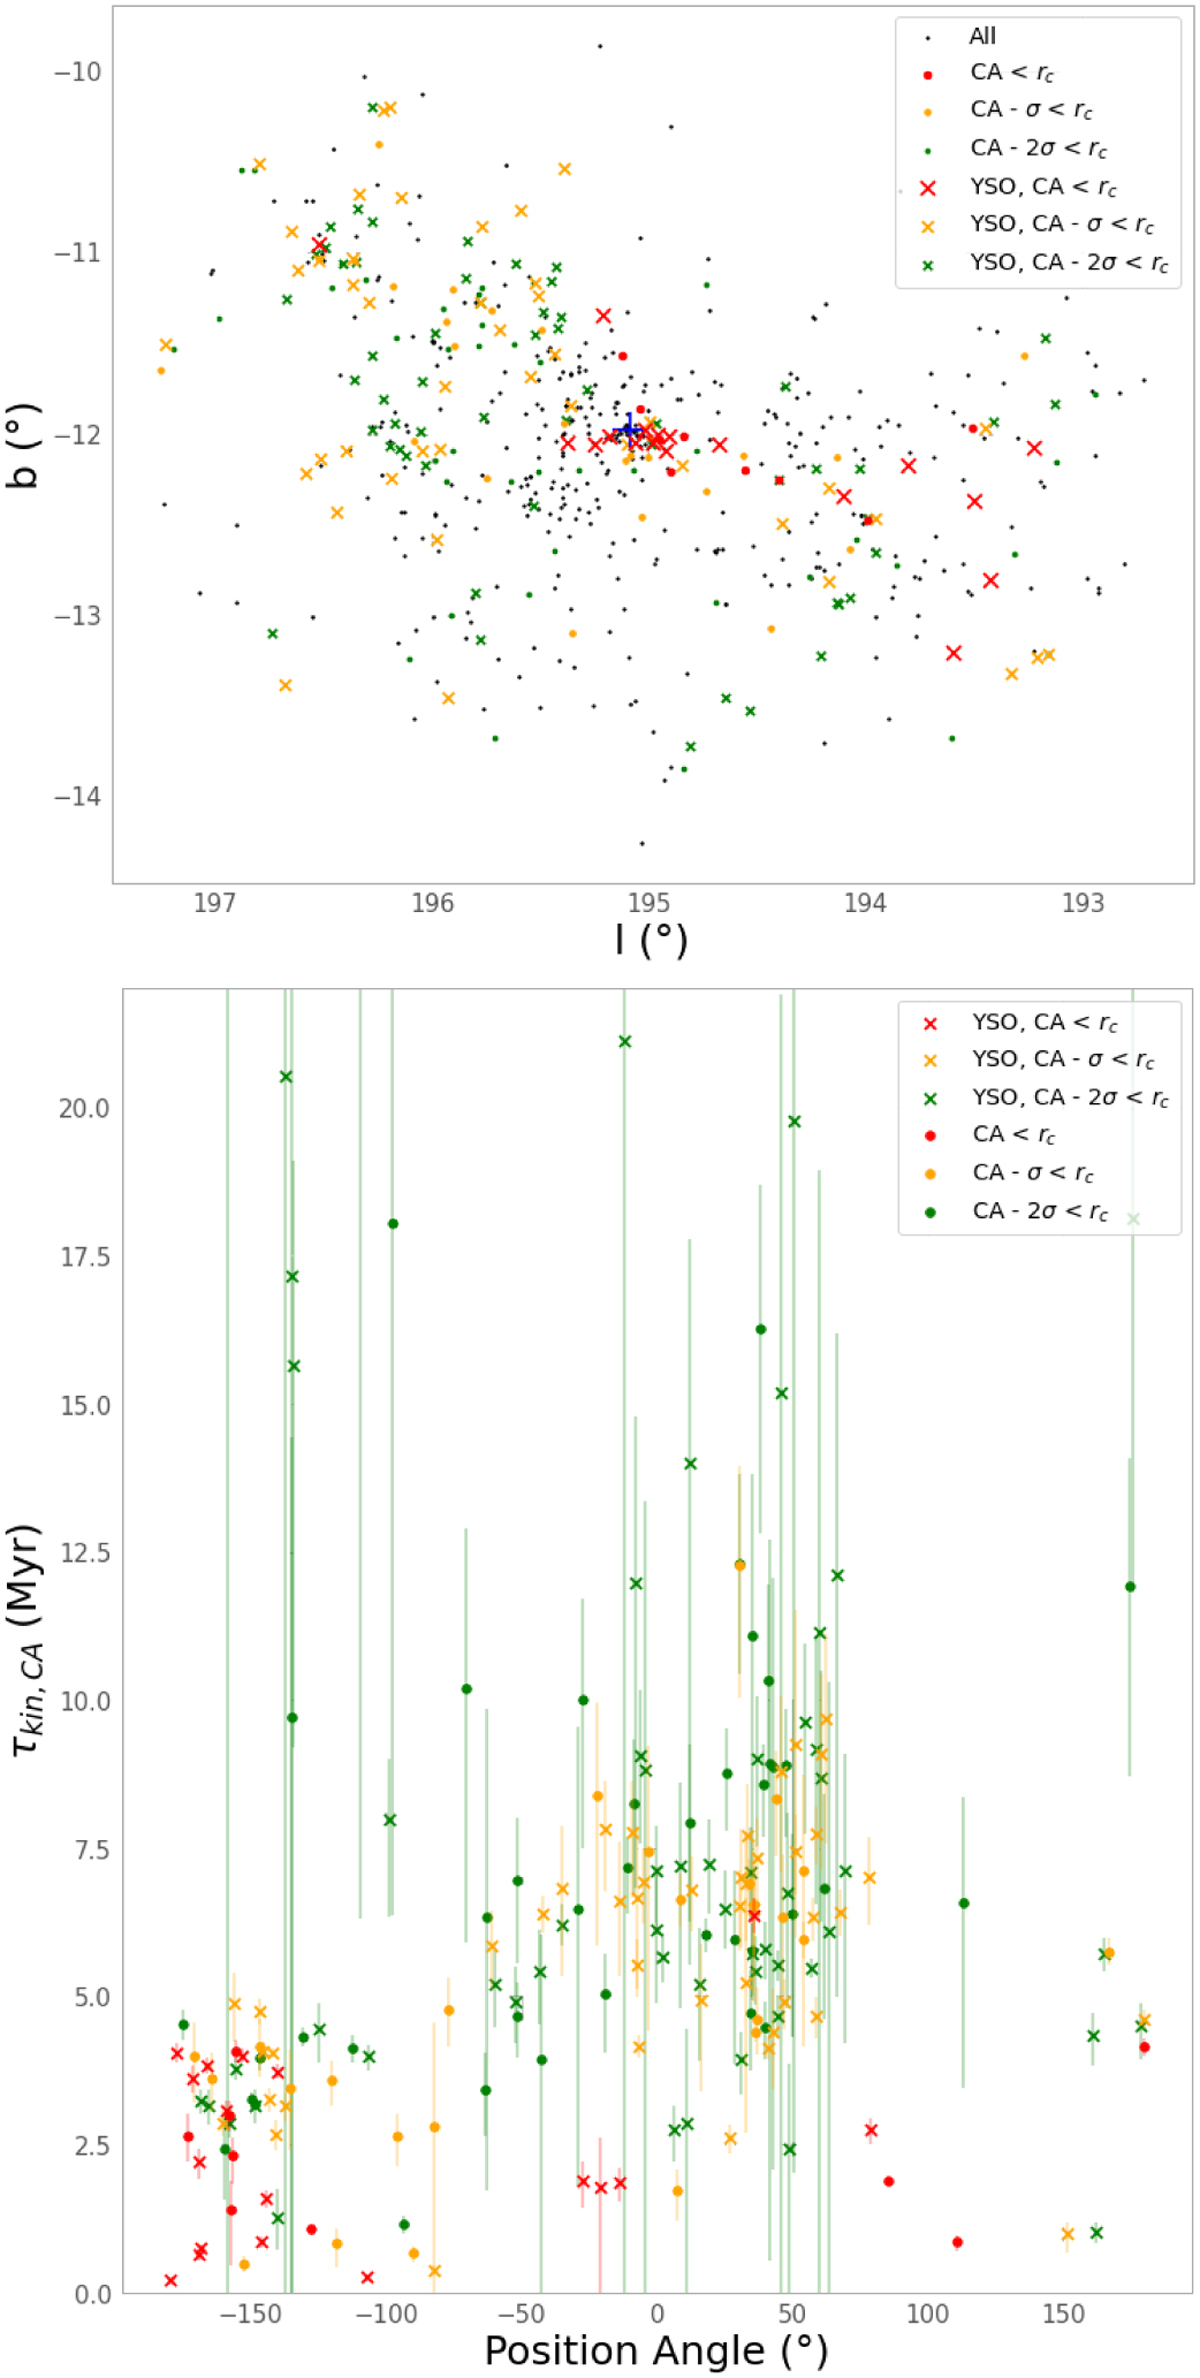
Properties of candidate ejected stars. Top: galactic coordinates of the λ Ori cluster members (black) with members that traceback to within the core radius (CA < rc) in red, members that traceback to the core radius within 1σ (CA − σ < rc) in yellow, members that traceback to the core radius within 2σ (CA − 2σ < rc) in green, and the position of the cluster centre denoted with a blue cross. Cluster members consistent with traceback to the core radius that match with the Gaia DR3 varYSO catalogue (Marton et al. 2023) are plotted with X’s. Bottom: position angle (°) around the cluster centre from the direction of increasing Galactic longitude for λ Ori cluster members that traceback to within the core radius (CA < rc) in red, members that traceback to the core radius within 1σ (CA − σ < rc) in yellow, and members that traceback to the core radius within 2σ (CA − 2σ < rc) in green against a timescale of 2D traceback to the point of closest approach to the cluster centre τkin,CA. Cluster members consistent with traceback to the core radius that match with the Gaia DR3 varYSO catalogue (Marton et al. 2023) are plotted with X’s.
Current usage metrics show cumulative count of Article Views (full-text article views including HTML views, PDF and ePub downloads, according to the available data) and Abstracts Views on Vision4Press platform.
Data correspond to usage on the plateform after 2015. The current usage metrics is available 48-96 hours after online publication and is updated daily on week days.
Initial download of the metrics may take a while.