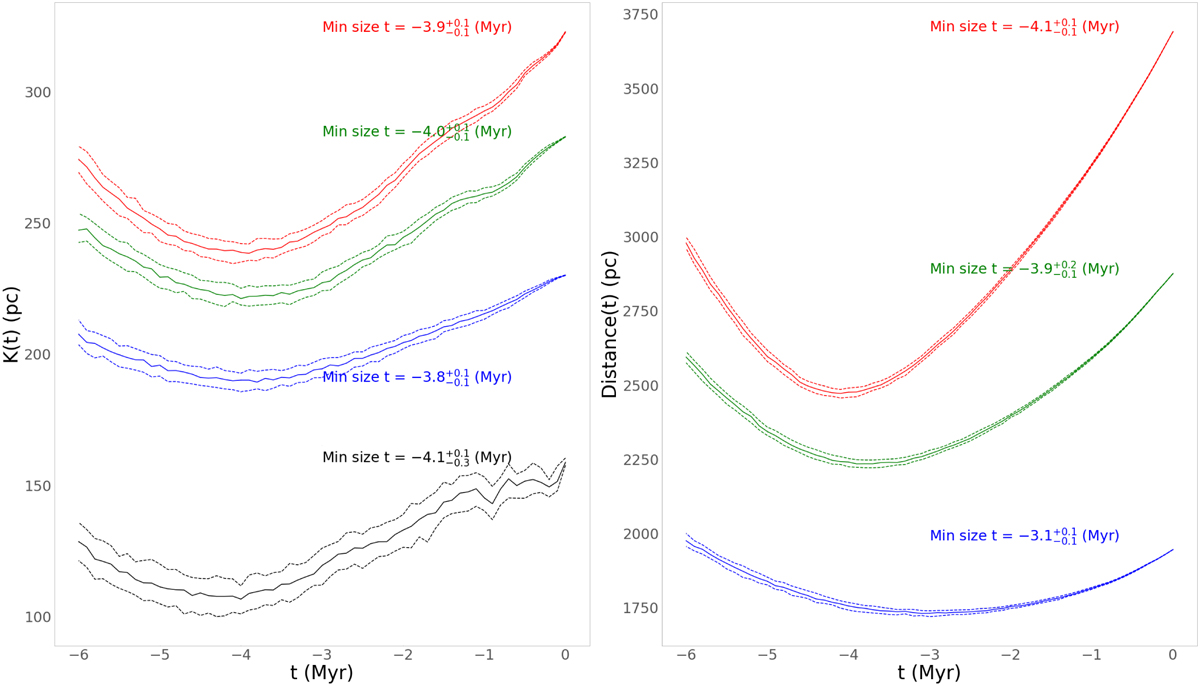
Fig. 13
Download original image
Minimum area traceback. Left: minimum spanning tree total length as a function of traceback time with no filter for outliers (red), 3σ velocity outliers removed (green), 2σ velocity outliers removed (blue), and 32% of the longest branches removed (black) and with their respective uncertainties. Right: sum of distances for each star to the association centre as a function of traceback time with no filter for outliers (red), 3σ velocity outliers removed (green), and 2σ velocity outliers removed (blue).
Current usage metrics show cumulative count of Article Views (full-text article views including HTML views, PDF and ePub downloads, according to the available data) and Abstracts Views on Vision4Press platform.
Data correspond to usage on the plateform after 2015. The current usage metrics is available 48-96 hours after online publication and is updated daily on week days.
Initial download of the metrics may take a while.