Fig. 10
Download original image
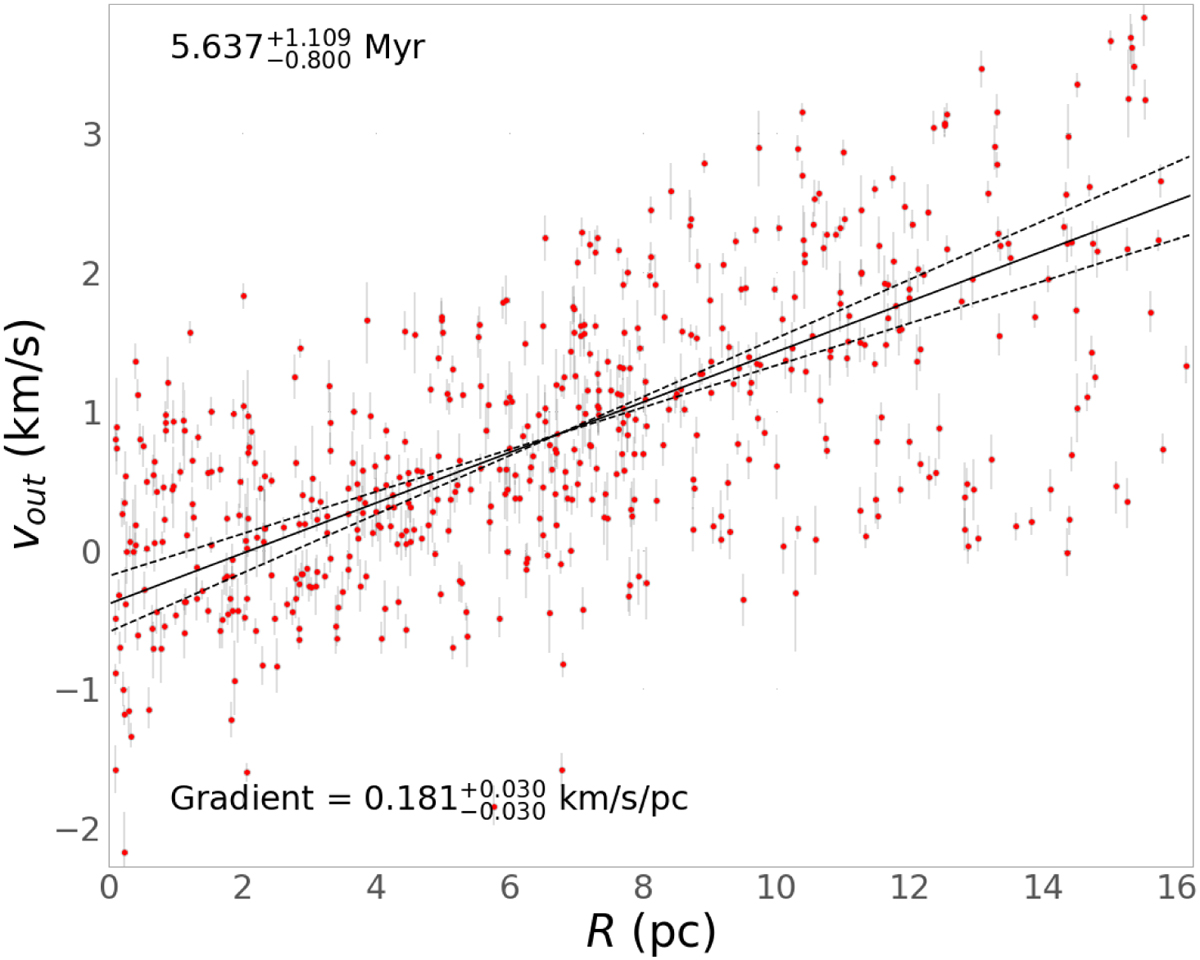
Distance from cluster centre (pc) versus vout (kms−1). The uncertainties for members of λ Ori are in red. The best-fitting gradients and the 16 and 84th percentiles values of the fit are shown as solid and dashed lines respectively in each panel. The best-fit gradient (rate of expansion) and uncertainties are given in kms−1 pc−1 as well as the corresponding timescale of expansion and uncertainties in Myrs.
Current usage metrics show cumulative count of Article Views (full-text article views including HTML views, PDF and ePub downloads, according to the available data) and Abstracts Views on Vision4Press platform.
Data correspond to usage on the plateform after 2015. The current usage metrics is available 48-96 hours after online publication and is updated daily on week days.
Initial download of the metrics may take a while.