Fig. 6
Download original image
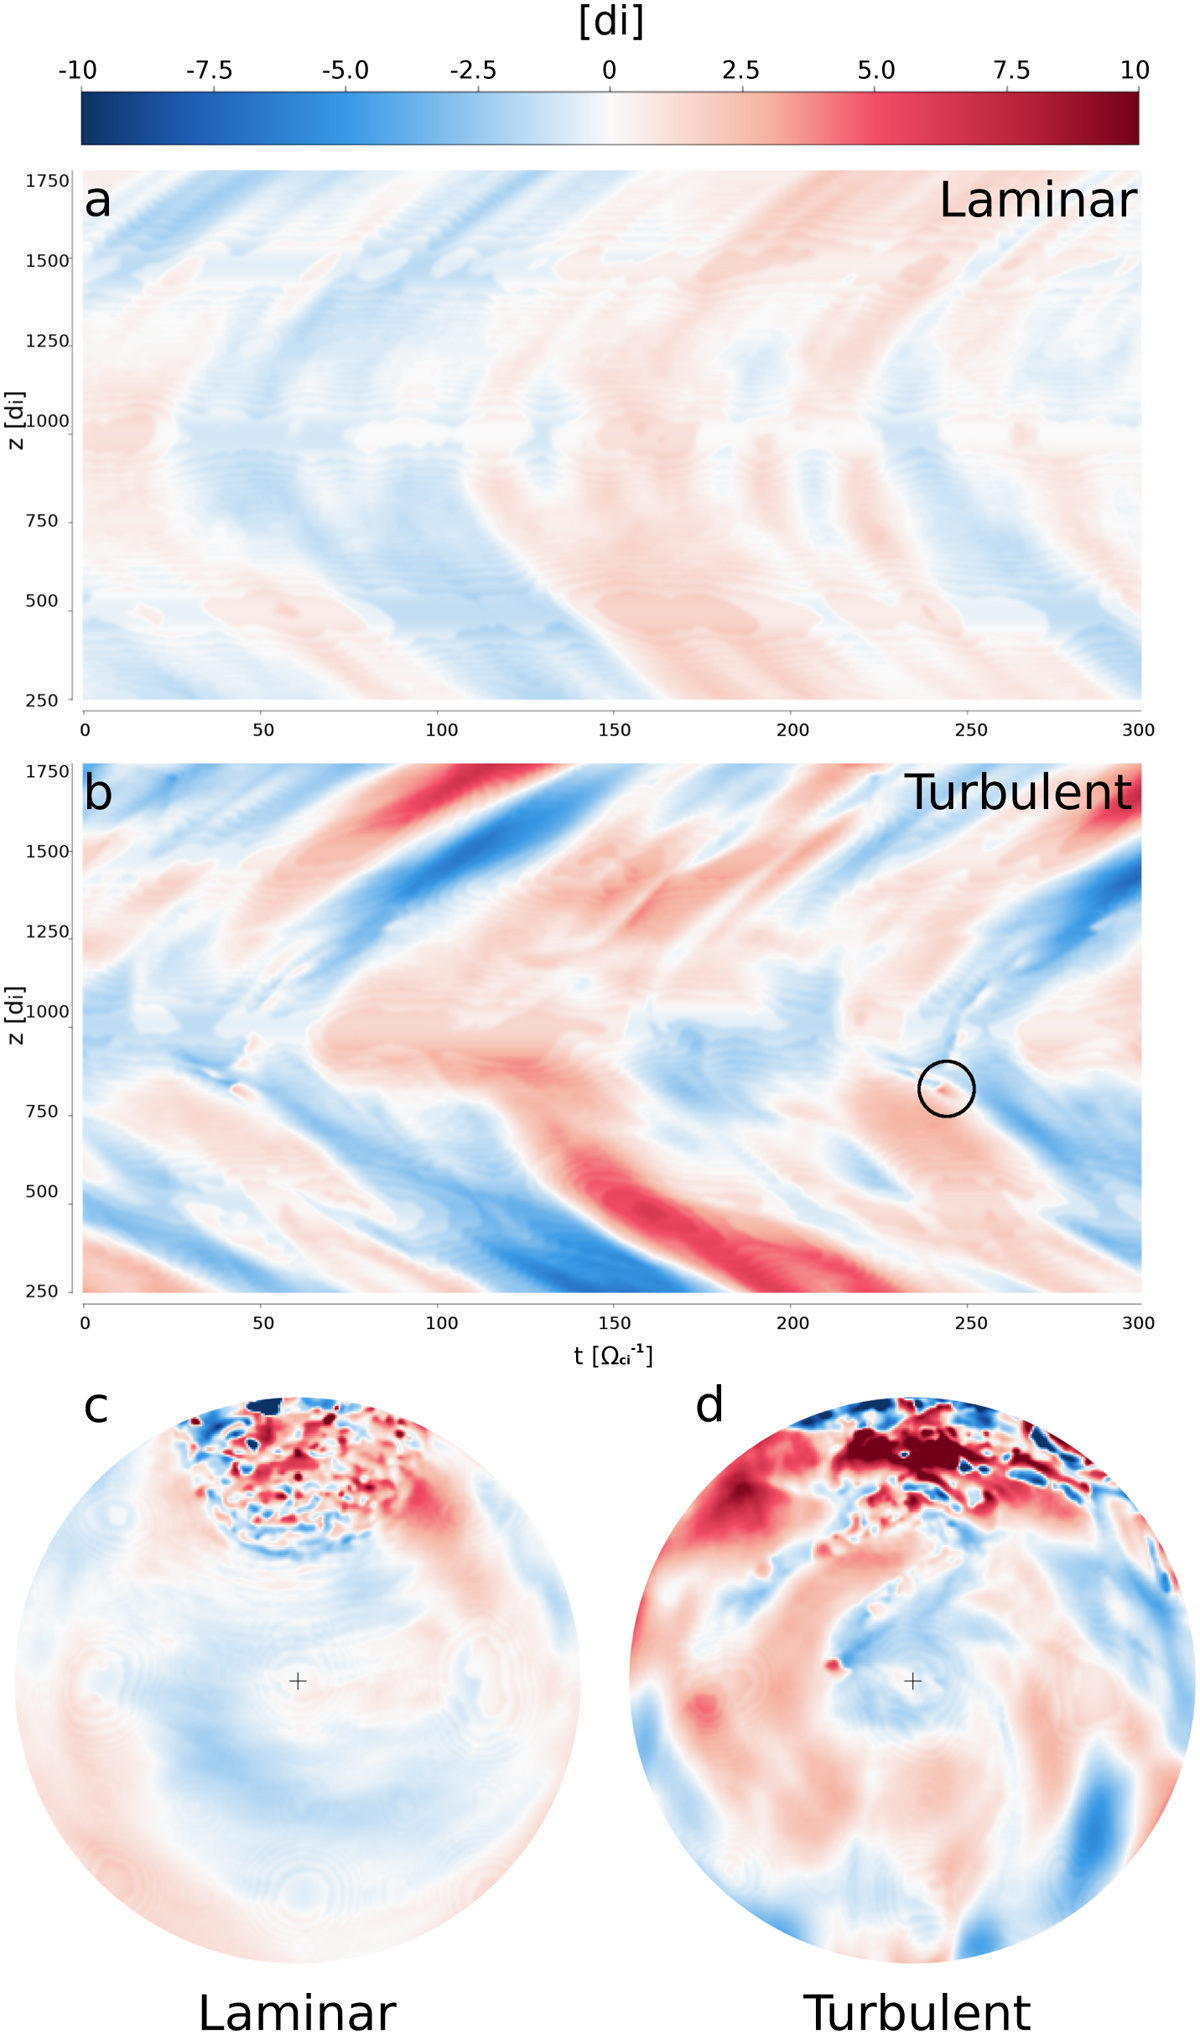
Temporal evolution of the deviation from the time-averaged bow shock position for the coordinates (YP, Z) in the laminar (a) and turbulent (b) case. The color code provides the deviation in di . The black circle points to the “bubble” appearing around (1000, 800) di in Figs. 2e, 3e, and 4e and reported in Fig. 7. The planar projection of the full 3D shock surface deviation at ![]() is shown in panels c and d. A movie is available online.
is shown in panels c and d. A movie is available online.
Current usage metrics show cumulative count of Article Views (full-text article views including HTML views, PDF and ePub downloads, according to the available data) and Abstracts Views on Vision4Press platform.
Data correspond to usage on the plateform after 2015. The current usage metrics is available 48-96 hours after online publication and is updated daily on week days.
Initial download of the metrics may take a while.