Open Access
Fig. 5
Download original image
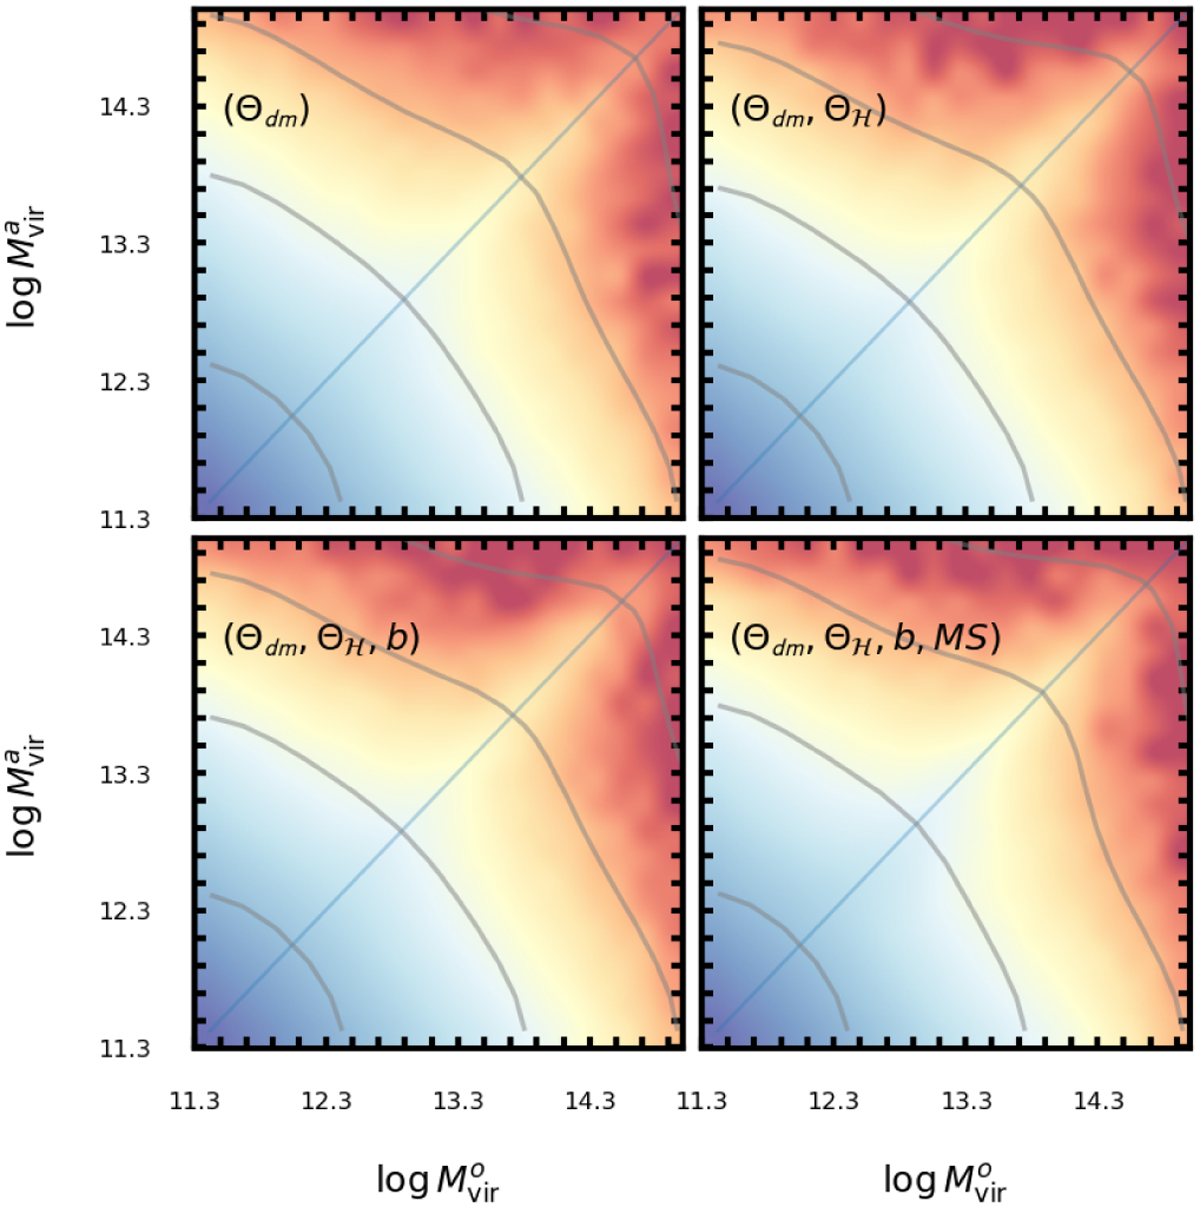
Scaling relation between the logarithm of the assigned virial mass ***(eq14)***![]() and the logarithm of the true virial mass ***(eq15)***
and the logarithm of the true virial mass ***(eq15)***![]() , for four different setups in the assignment algorithm (at ɀ = 0). The color coding and contours indicate the constant number of tracers from high (blue) to low (red).
, for four different setups in the assignment algorithm (at ɀ = 0). The color coding and contours indicate the constant number of tracers from high (blue) to low (red).
Current usage metrics show cumulative count of Article Views (full-text article views including HTML views, PDF and ePub downloads, according to the available data) and Abstracts Views on Vision4Press platform.
Data correspond to usage on the plateform after 2015. The current usage metrics is available 48-96 hours after online publication and is updated daily on week days.
Initial download of the metrics may take a while.