Fig. 3
Download original image
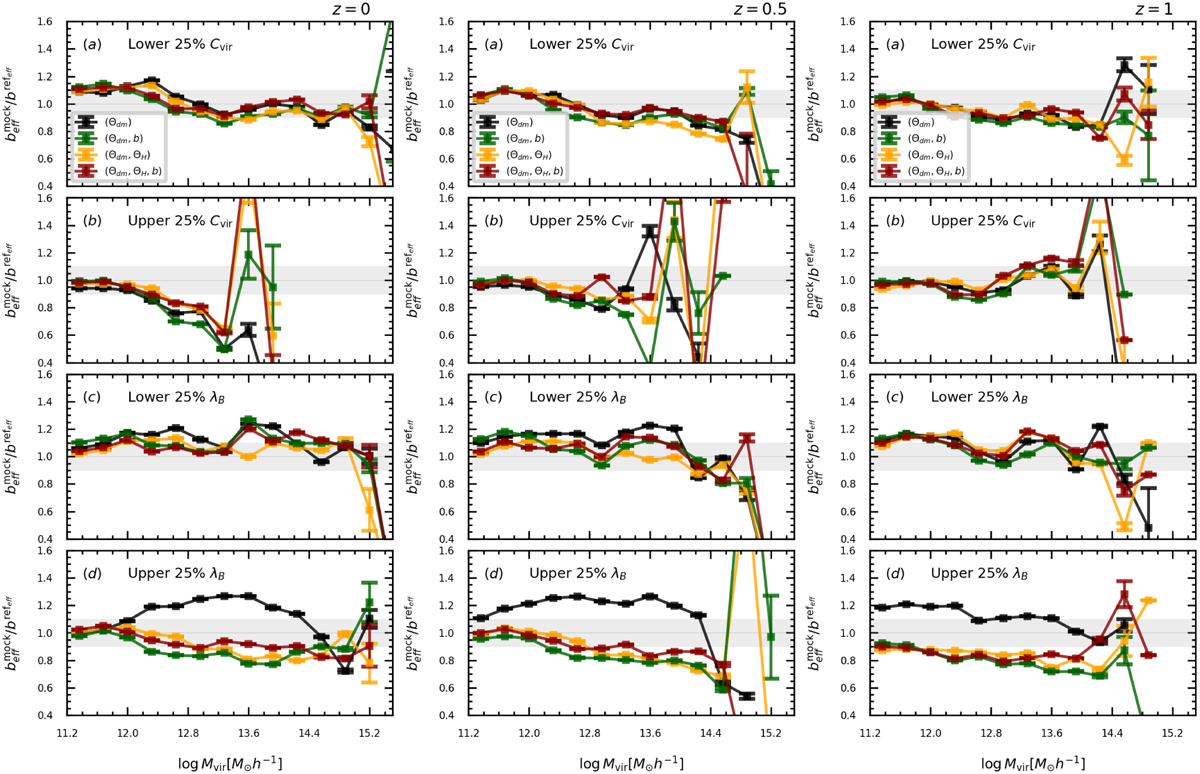
Secondary effective bias as a function of halo virial mass. This plot compares (with ratios) the effective bias measured reference and the mock after assignment, at two different cosmological redshifts (shown in different columns) and using different combinations of halo vs. dark matter properties, as shown in the legends. Panels a and b show the secondary bias using halo concentration, for the lower and upper quartiles computed in each mass bin, respectively. Similarly, panels c and d show the secondary bias as a function of halo spin. In all plots, the shaded region denotes a 10% deviation from unity. In all cases, MS is employed. The error bars are computed by adding in quadrature the corresponding uncertainties in each bias estimate.
Current usage metrics show cumulative count of Article Views (full-text article views including HTML views, PDF and ePub downloads, according to the available data) and Abstracts Views on Vision4Press platform.
Data correspond to usage on the plateform after 2015. The current usage metrics is available 48-96 hours after online publication and is updated daily on week days.
Initial download of the metrics may take a while.