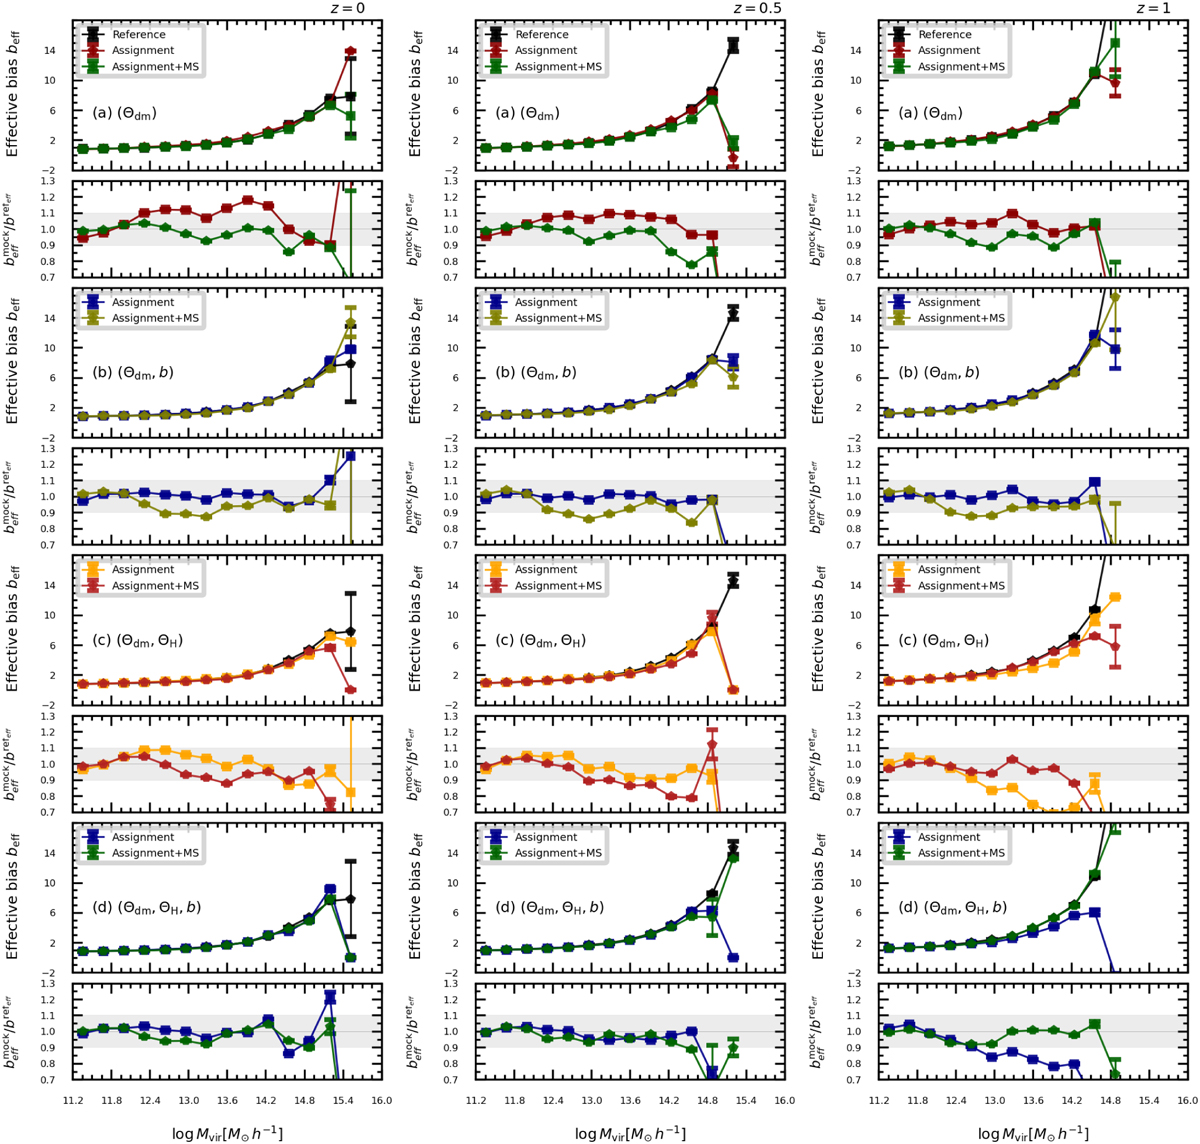
Fig. 2
Download original image
Large-scale effective bias as a function of virial mass, assigned as described in Sect. 3. The main panels (a,b,c,d) show the effective bias measured from the reference and the results from the property assignment at ɀ = 0 (left), ɀ = 0.5 (center), and ɀ = 1 (right column), with (labeled Assignment+MS) and without (labeled Assignment) the MS approach. Panel a shows the results of using only dark matter properties Θdm in the assignment of maximum circular velocity and virial mass. Panel b shows the results of adding the information from the individual bias. Panel c shows the results after including halo environment properties ΘH, and panel d shows the result of including both bias and environment properties. The bottom panels show, in each case, the ratio to the primary bias obtained from the mock catalog using its original properties (the latter shown as black points in all main panels). The gray region in these bottom panels depicts 10% deviation with respect to unity. The error bars denote the error on the mean bias-property relation.
Current usage metrics show cumulative count of Article Views (full-text article views including HTML views, PDF and ePub downloads, according to the available data) and Abstracts Views on Vision4Press platform.
Data correspond to usage on the plateform after 2015. The current usage metrics is available 48-96 hours after online publication and is updated daily on week days.
Initial download of the metrics may take a while.