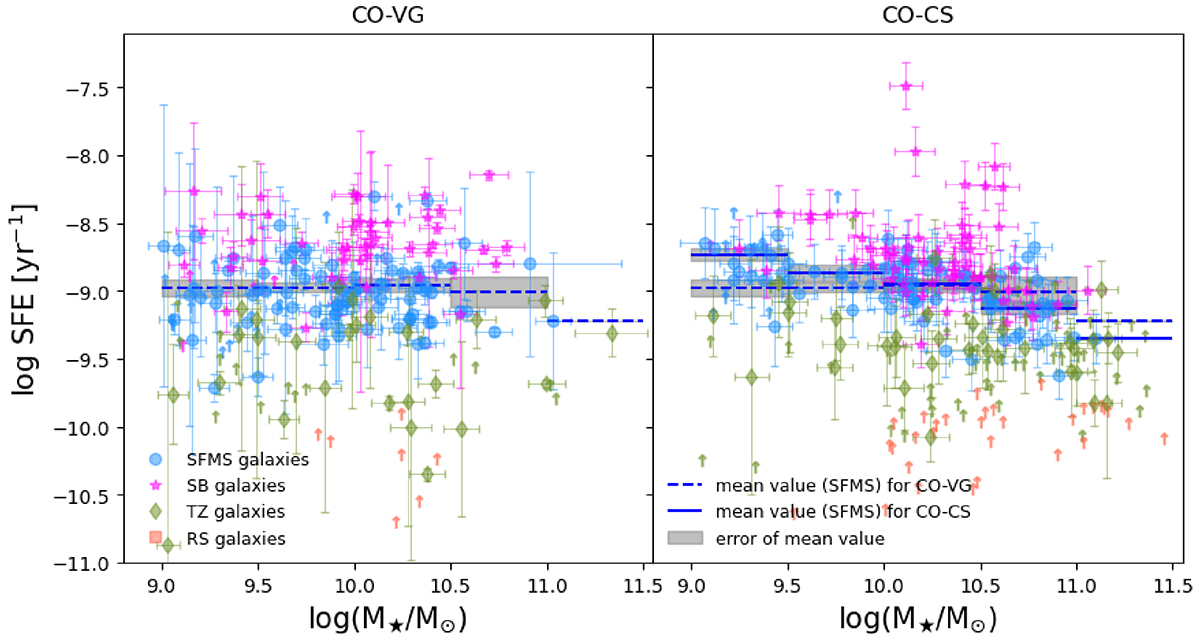
Fig. 7.
Download original image
Star formation efficiency as a function of stellar mass for the CO-VG sample (left) and the CO-CS (right) sample. Galaxies are colour coded according to their position on the SFMS as described in Fig. 3. The mean logarithm of the SFE per M⋆ bin is shown with a blue dashed line for the CO-VG and a blue solid line for the CO-CS sample, considering only those galaxies that belong to the SFMS. The extent of this line represent the width of the stellar mass bin. The error of the mean value is represented with a grey shadow. The lower limits are shown with upward-pointing arrows.
Current usage metrics show cumulative count of Article Views (full-text article views including HTML views, PDF and ePub downloads, according to the available data) and Abstracts Views on Vision4Press platform.
Data correspond to usage on the plateform after 2015. The current usage metrics is available 48-96 hours after online publication and is updated daily on week days.
Initial download of the metrics may take a while.