| Issue |
A&A
Volume 670, February 2023
|
|
|---|---|---|
| Article Number | C3 | |
| Number of page(s) | 5 | |
| Section | Extragalactic astronomy | |
| DOI | https://doi.org/10.1051/0004-6361/202141888e | |
| Published online | 10 February 2023 | |
CO-CAVITY pilot survey: Molecular gas and star formation in void galaxies (Corrigendum)
1
Universidad de Granada (ugr), Departamento de Física Teórica y del Cosmos, Campus Fuente Nueva, Edificio Mecenas, 18071 Granada, Spain
e-mail: This email address is being protected from spambots. You need JavaScript enabled to view it.
, This email address is being protected from spambots. You need JavaScript enabled to view it.
, This email address is being protected from spambots. You need JavaScript enabled to view it.
2
Instituto Carlos I de Física Tórica y Computacional, Facultad de Ciencias, 18071 Granada, Spain
3
Australian Astronomical Optics, Macquarie University, 105 Delhi Rd, North Ryde, NSW 2113, Australia
4
Department of Physics and Astronomy, Macquarie University, NSW 2109, Australia
5
Macquarie University Research Centre for Astronomy, Astrophysics & Astrophotonics, Sydney, NSW 2109, Australia
6
ARC Centre of Excellence for All Sky Astrophysics in 3 Dimensions (ASTRO-3D), Australia
7
Département de Physique, de Génie Physique et d’Optique, Université Laval, and Centre de Recherche en Astrophysique du Québec (CRAQ), Québec, QC G1V 0A6, Canada
8
Instituto de Astrofísica de Andalucía – CSIC, Glorieta de la Astronomía s.n., 18008 Granada, Spain
9
Instituto de Astrofísica de Canarias, Vía Láctea s/n, 38205 La Laguna, Tenerife, Spain
10
Departamento de Astrofísica, Universidad de La Laguna, 38200 La Laguna, Tenerife, Spain
11
Astronomisches Rechen-Institut, Zentrum für Astronomie der Universität Heidelberg, Mönchhofstraße 12-14, 69120 Heidelberg, Germany
12
Kapteyn Astronomical Institute, University of Groningen, Landleven 12, 9747 AD Groningen, The Netherlands
Key words: ISM: molecules / ISM: atoms / galaxies: star formation / Galaxy: evolution / large-scale structure of Universe / errata, addenda
We have noticed an error related to the CO-to-H2 conversion factor (αCO) for the extended CO Legacy Database for the GALEX Arecibo SDSS Survey (xCOLD-GASS, Saintonge et al. 2017) control sample in Sect. 2.2.2. We had indicated that the molecular gas masses of xCOLD-GASS that we used in our paper were based on a fixed αCO = 3.2 M⊙ (K km s−1 pc2)−1, the same as used for our void galaxies. This was wrong. We used the molecular gas data from the xCOLD-GASS sample presented in Saintonge et al. (2017). These data are based on a CO-to-H2 conversion factor calibrated by Accurso et al. (2017), which is metallicity-dependent and has a second-order dependence on the offset of a galaxy from the star-forming main sequence.
In order to provide a fair comparison between our void sample and xCOLD-GASS, we re-scaled the molecular gas mass of the xCOLD-GASS galaxies to the same value of the CO-to-H2 conversion factor, αCO, as used for our void sample (a constant αCO = 3.2 M⊙ (K km s−1 pc2)−1, corresponding to the Galactic value, not taking into account the presence of helium). We show the figures and tables that have been affected by this correction. The main conclusions of our original paper are unaltered by these changes.
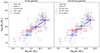 |
Fig. 5. Molecular gas mass as a function of stellar mass for the CO-VGS and CO-CS with all the galaxies (left) and only star-forming galaxies (right). The mean MH2 per M⋆ bin is shown with a red symbol (connected by a solid red line to guide the eye) for the CO-VGS, and with a blue symbol (and dashed blue line) for the CO-CS. The error bar in M⋆ represents the width of the stellar mass bin. |
Comparison of molecular gas mass between CO-VGS (Void Galaxy Survey with CO data) and CO-CS (Control Sample with CO data).
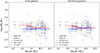 |
Fig. 6. Molecular gas mass fraction as a function of stellar mass for the CO-VGS and CO-CS with all the galaxies (left) and only star-forming galaxies (right). The mean MH2/M⋆ per M⋆ bin is shown with a red symbol (connected by a solid red line to guide the eye) for the CO-VGS, and with a blue symbol (and dashed blue line) for the CO-CS. The error bar in M⋆ represents the width of the stellar mass bin. |
Molecular gas mass fraction.
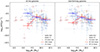 |
Fig. 7. Star formation efficiency (SFE) as a function of stellar mass for the CO-VGS and CO-CS with all the galaxies (left) and only star-forming galaxies (right). The mean SFE per M⋆ bin is shown with a red symbol (connected by a solid red line to guide the eye) for the CO-VGS, and with a blue symbol (and dashed blue line) for the CO-CS. The error bar in M⋆ represents the width of the stellar mass bin. |
Star formation efficiency.
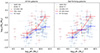 |
Fig. 9. Molecular-to-atomic gas mass ratio as a function of stellar mass for the CO-VGS and the CO-CS with all the galaxies (left) and only star-forming galaxies (right). The mean MH2/MHI per M⋆ bin is calculated taking upper limits into account but not lower ones, and it is shown with a red symbol (connected by a solid red line to guide the eye) for the CO-VGS, and with a blue symbol (and dashed blue line) for the CO-CS. The error bar in M⋆ represents the width of the stellar mass bin. |
Molecular-to-atomic gas mass ratio.
References
- Accurso, G., Saintonge, A., Catinella, B., et al. 2017, MNRAS, 470, 4750 [NASA ADS] [Google Scholar]
- Saintonge, A., Catinella, B., Tacconi, L. J., et al. 2017, ApJS, 233, 22 [Google Scholar]
© The Authors 2023
 Open Access article, published by EDP Sciences, under the terms of the Creative Commons Attribution License (https://creativecommons.org/licenses/by/4.0), which permits unrestricted use, distribution, and reproduction in any medium, provided the original work is properly cited.
This article is published in open access under the Subscribe-to-Open model. This email address is being protected from spambots. You need JavaScript enabled to view it. to support open access publication.
All Tables
Comparison of molecular gas mass between CO-VGS (Void Galaxy Survey with CO data) and CO-CS (Control Sample with CO data).
All Figures
|
Fig. 5. Molecular gas mass as a function of stellar mass for the CO-VGS and CO-CS with all the galaxies (left) and only star-forming galaxies (right). The mean MH2 per M⋆ bin is shown with a red symbol (connected by a solid red line to guide the eye) for the CO-VGS, and with a blue symbol (and dashed blue line) for the CO-CS. The error bar in M⋆ represents the width of the stellar mass bin. |
| In the text | |
|
Fig. 6. Molecular gas mass fraction as a function of stellar mass for the CO-VGS and CO-CS with all the galaxies (left) and only star-forming galaxies (right). The mean MH2/M⋆ per M⋆ bin is shown with a red symbol (connected by a solid red line to guide the eye) for the CO-VGS, and with a blue symbol (and dashed blue line) for the CO-CS. The error bar in M⋆ represents the width of the stellar mass bin. |
| In the text | |
|
Fig. 7. Star formation efficiency (SFE) as a function of stellar mass for the CO-VGS and CO-CS with all the galaxies (left) and only star-forming galaxies (right). The mean SFE per M⋆ bin is shown with a red symbol (connected by a solid red line to guide the eye) for the CO-VGS, and with a blue symbol (and dashed blue line) for the CO-CS. The error bar in M⋆ represents the width of the stellar mass bin. |
| In the text | |
|
Fig. 9. Molecular-to-atomic gas mass ratio as a function of stellar mass for the CO-VGS and the CO-CS with all the galaxies (left) and only star-forming galaxies (right). The mean MH2/MHI per M⋆ bin is calculated taking upper limits into account but not lower ones, and it is shown with a red symbol (connected by a solid red line to guide the eye) for the CO-VGS, and with a blue symbol (and dashed blue line) for the CO-CS. The error bar in M⋆ represents the width of the stellar mass bin. |
| In the text | |
Current usage metrics show cumulative count of Article Views (full-text article views including HTML views, PDF and ePub downloads, according to the available data) and Abstracts Views on Vision4Press platform.
Data correspond to usage on the plateform after 2015. The current usage metrics is available 48-96 hours after online publication and is updated daily on week days.
Initial download of the metrics may take a while.