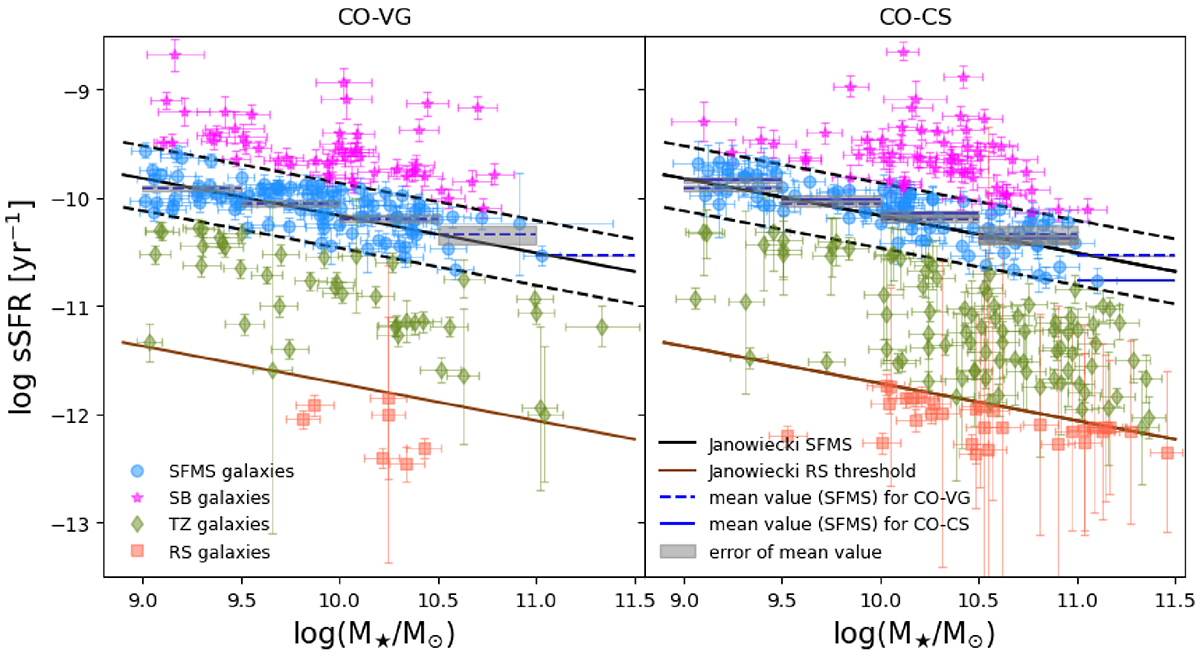
Fig. 3.
Download original image
Specific star formation rate as a function of stellar mass for the CO-VG sample (left) and the CO-CS sample (right). The SFMS is represented as a solid black line, and was derived as in Janowiecki et al. (2020, their Eq. 1). The dashed black lines represent the ±0.3 dex offset to the SFMS (Janowiecki et al. 2020) and the brown solid line represents the threshold of the RS, as also defined by Janowiecki et al. (2020, SFMS < 1.55 dex). Galaxies are colour coded according to their positions on the SFMS: (i) pink stars represent SB galaxies that lie above the SFMS, (ii) blue dots are SF galaxies within the SFMS (±0.3 dex), (iii) green diamonds are galaxies that lie in the TZ, and (iv) orange squares show RS galaxies below the TZ (SFMS < 1.55 dex). The mean sSFR per M⋆ bin is shown with a blue dashed line for the CO-VG and blue solid line for the CO-CS considering only those galaxy that belong to the SFMS. The extent of this line represents the width of the stellar mass bin. The error on the mean value is represented with a grey shadow.
Current usage metrics show cumulative count of Article Views (full-text article views including HTML views, PDF and ePub downloads, according to the available data) and Abstracts Views on Vision4Press platform.
Data correspond to usage on the plateform after 2015. The current usage metrics is available 48-96 hours after online publication and is updated daily on week days.
Initial download of the metrics may take a while.