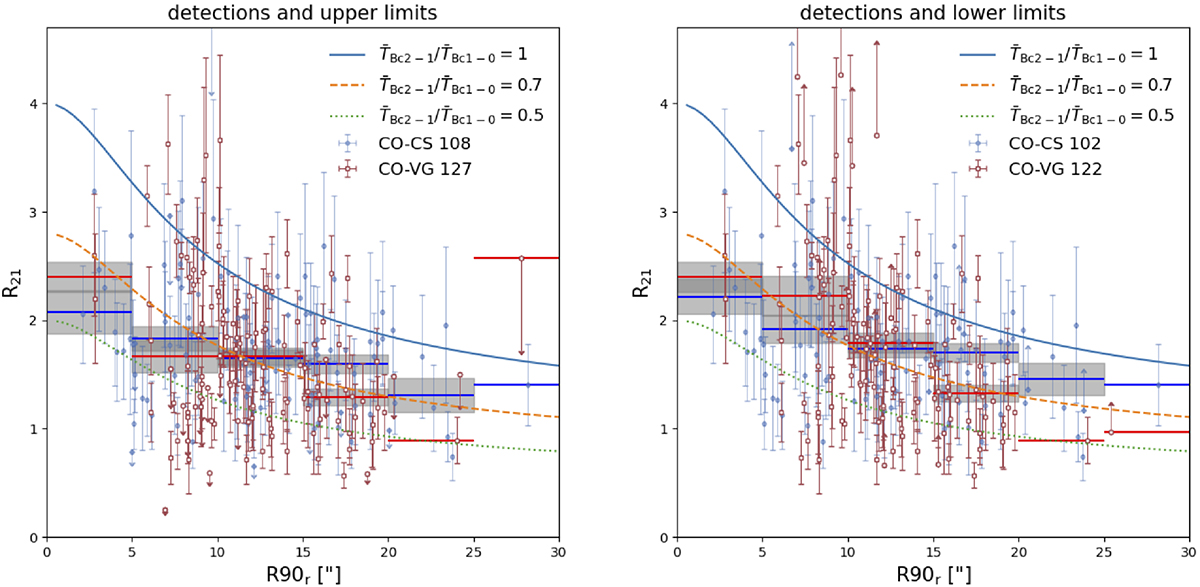
Fig. 10.
Download original image
Observed line-intensity ratio R21 = ICO(2 − 1)/ICO(1 − 0) as a function of the r-Petrosian R90, r. Left panel: Only detections and upper limits (i.e. data points with non-detections in ICO(1 − 0) were not considered). Right panel: Only detections and lower limits (i.e. data points with non-detections in ICO(2 − 1) were not considered.
Current usage metrics show cumulative count of Article Views (full-text article views including HTML views, PDF and ePub downloads, according to the available data) and Abstracts Views on Vision4Press platform.
Data correspond to usage on the plateform after 2015. The current usage metrics is available 48-96 hours after online publication and is updated daily on week days.
Initial download of the metrics may take a while.