Fig. 1.
Download original image
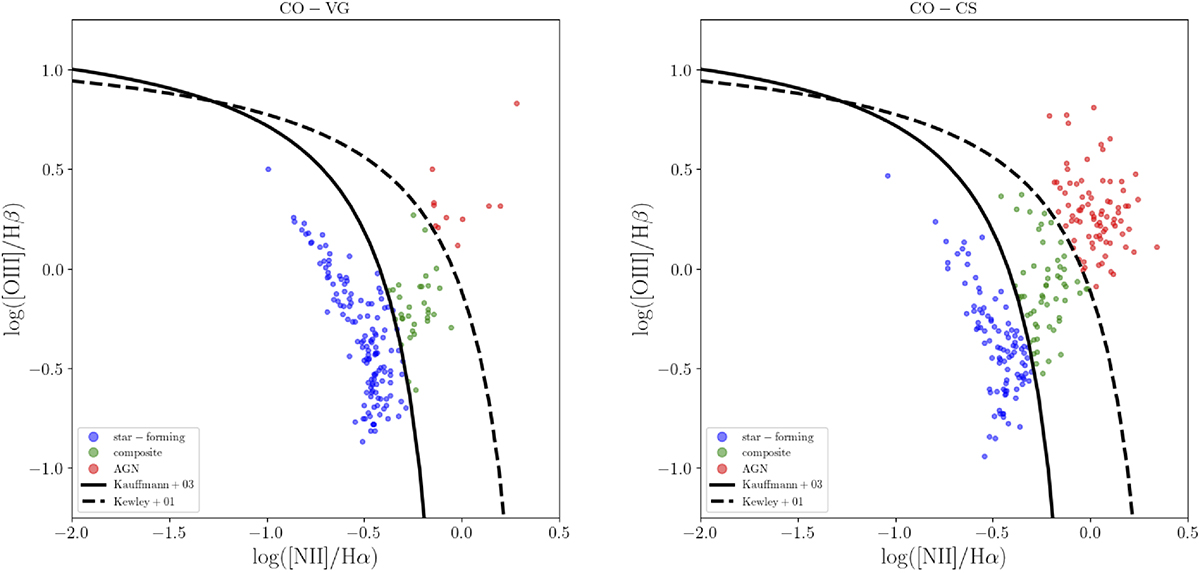
BPT diagnostic diagram for CO-VG galaxies (left) and CO-CS galaxies (right). Blue points represent star-forming galaxies, green points represent composite galaxies, and red points represent AGN galaxies. The dashed line represents the demarcation proposed by Kewley et al. (2001), while the solid line corresponds to the curve introduced by Kauffmann et al. (2003a).
Current usage metrics show cumulative count of Article Views (full-text article views including HTML views, PDF and ePub downloads, according to the available data) and Abstracts Views on Vision4Press platform.
Data correspond to usage on the plateform after 2015. The current usage metrics is available 48-96 hours after online publication and is updated daily on week days.
Initial download of the metrics may take a while.