Fig. 3.
Download original image
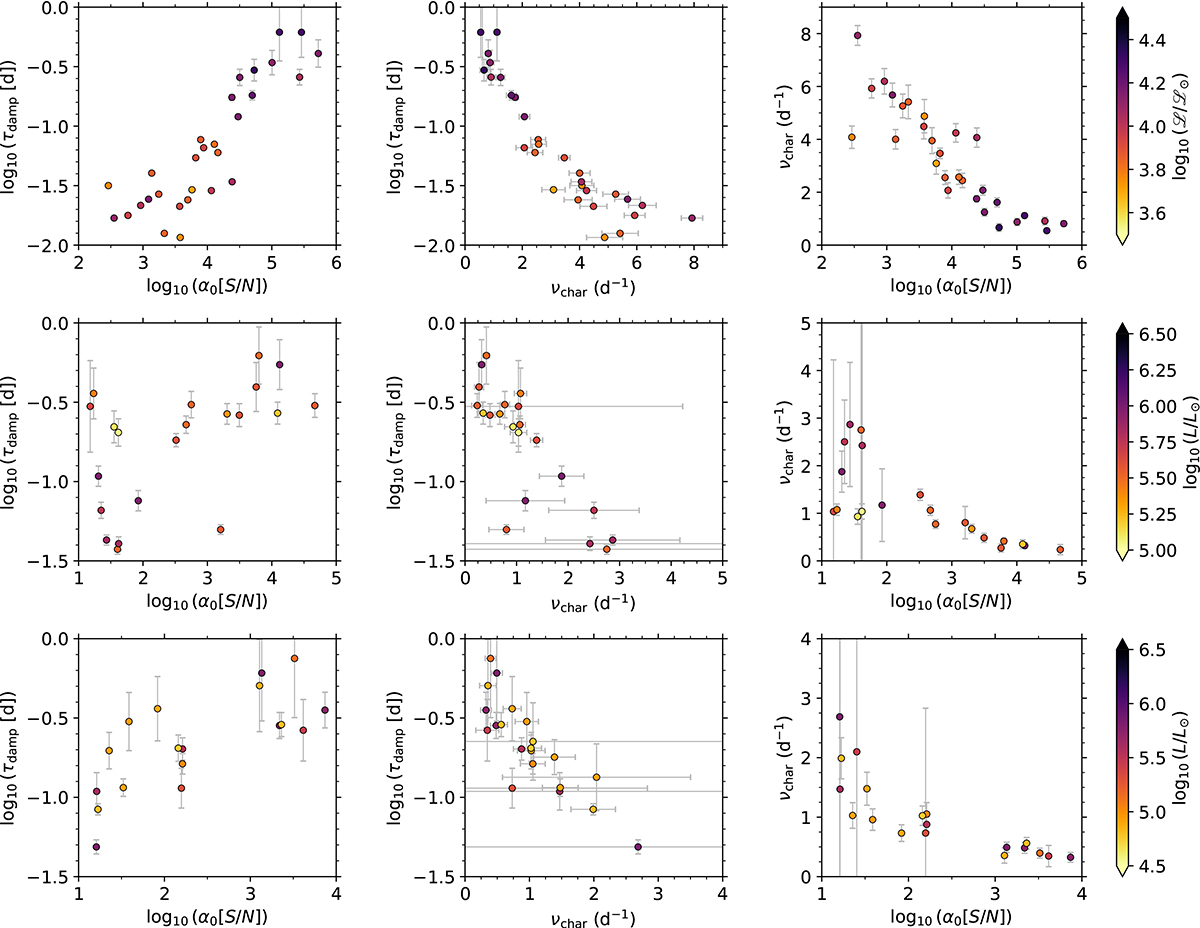
Correlations between (spectroscopic) luminosity and SLF variability parameters for the sub-samples of Milky Way, LMC, and SMC massive stars studied in this work are shown (from top to bottom). We note that the spectroscopic effective luminosity is defined as ![]() (Langer & Kudritzki 2014) with values taken from Bowman et al. (2020) for consistency. The uncertainties plotted are the 2σ confidence intervals from the combined methodology of a GP regression and Hamiltonian Monte Carlo with a no U-turn sampler (Bowman & Dorn-Wallenstein 2022).
(Langer & Kudritzki 2014) with values taken from Bowman et al. (2020) for consistency. The uncertainties plotted are the 2σ confidence intervals from the combined methodology of a GP regression and Hamiltonian Monte Carlo with a no U-turn sampler (Bowman & Dorn-Wallenstein 2022).
Current usage metrics show cumulative count of Article Views (full-text article views including HTML views, PDF and ePub downloads, according to the available data) and Abstracts Views on Vision4Press platform.
Data correspond to usage on the plateform after 2015. The current usage metrics is available 48-96 hours after online publication and is updated daily on week days.
Initial download of the metrics may take a while.