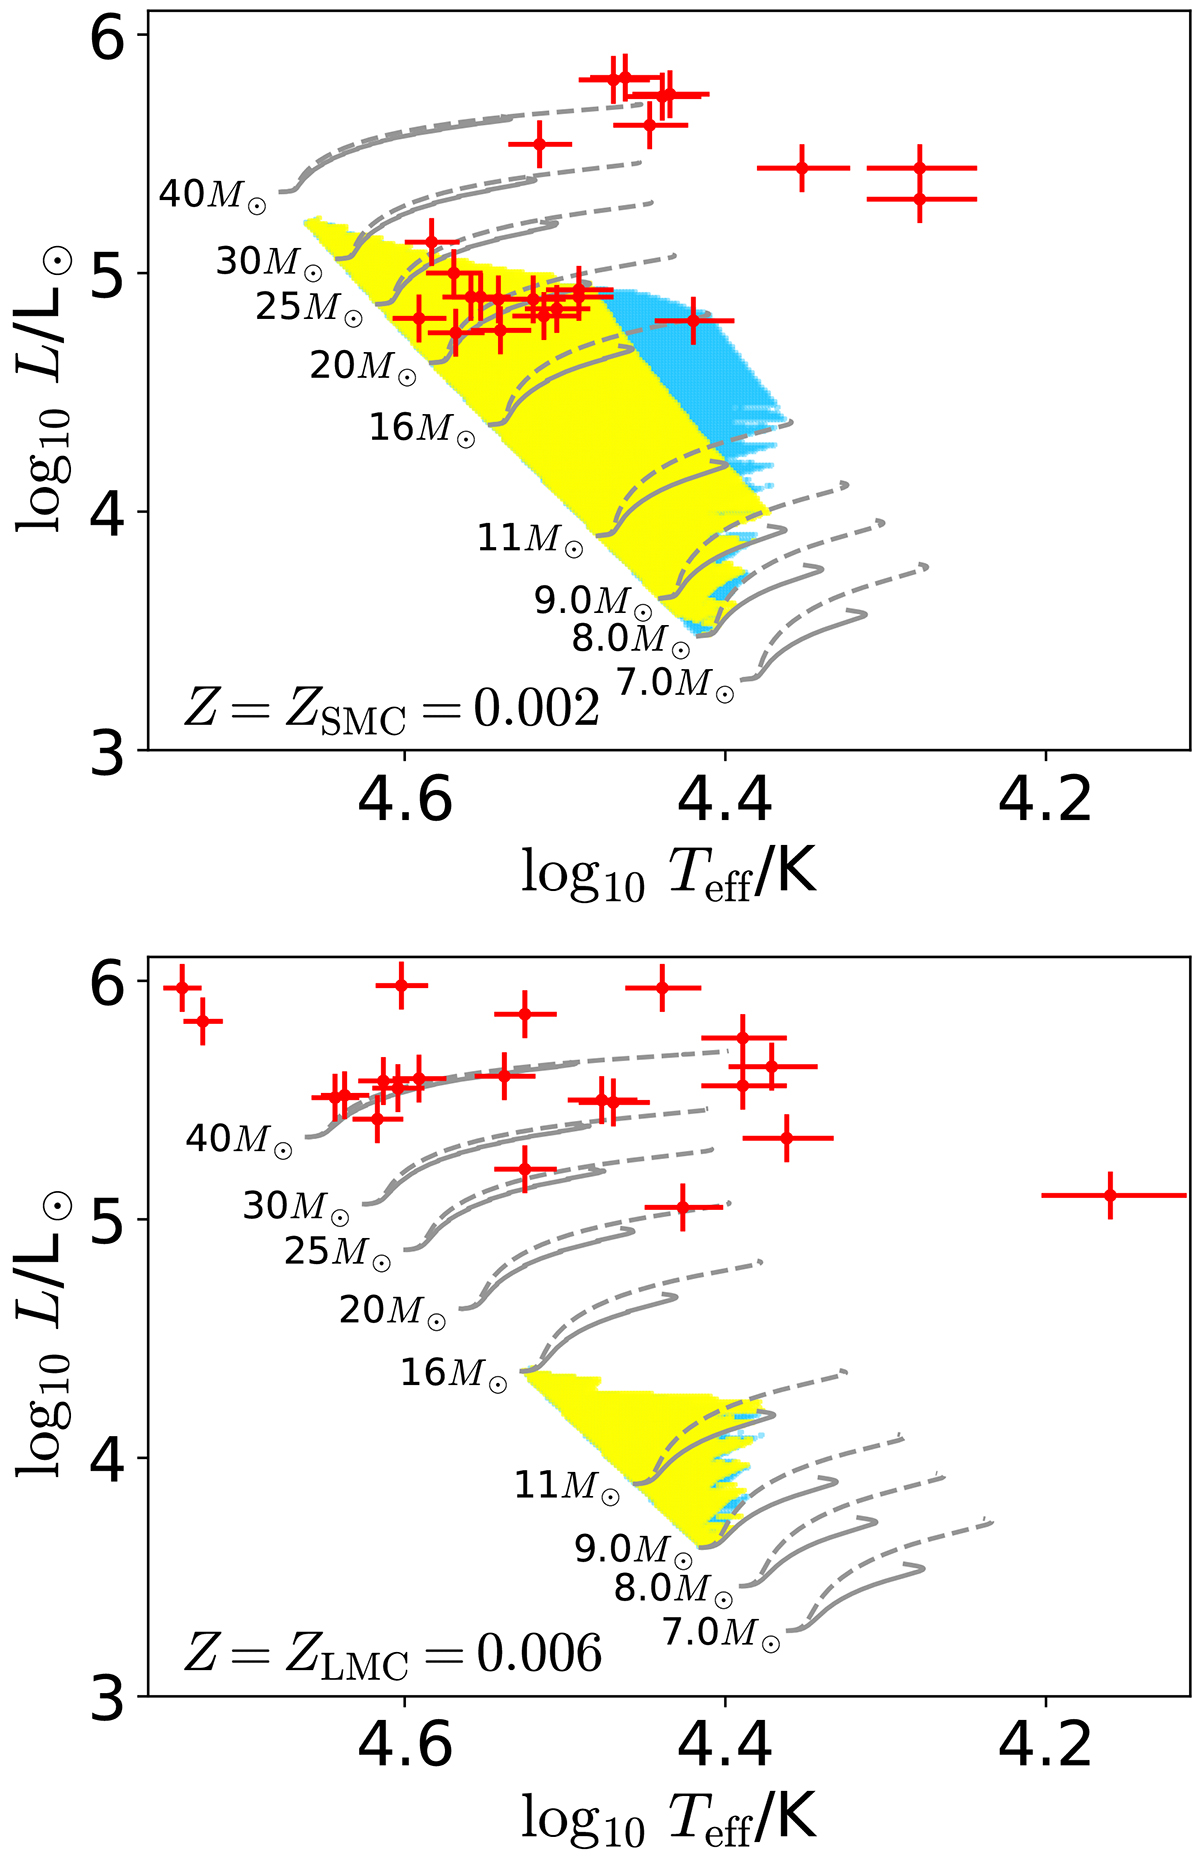
Fig. 1.
Download original image
Hertzsprung–Russell (HR) diagram for SMC stars (i.e. Z = 0.002; top panel) and LMC stars (i.e. Z = 0.006; bottom panel) with evolutionary tracks of different masses between the ZAMS and the TAMS. The sub-surface convection zone stability windows as defined by the region for which Ra < 0.001 Racrit (cf. Eq. (1)) are shown in yellow for models with minimum mixing and blue for the additional models with maximum values of mixing. Evolutionary tracks with minimum and maximum mixing are shown as solid and dashed lines, respectively. The location of the sub-sample of stars with reliable TESS light curves, all of which have significant SLF variability, are shown as red points.
Current usage metrics show cumulative count of Article Views (full-text article views including HTML views, PDF and ePub downloads, according to the available data) and Abstracts Views on Vision4Press platform.
Data correspond to usage on the plateform after 2015. The current usage metrics is available 48-96 hours after online publication and is updated daily on week days.
Initial download of the metrics may take a while.