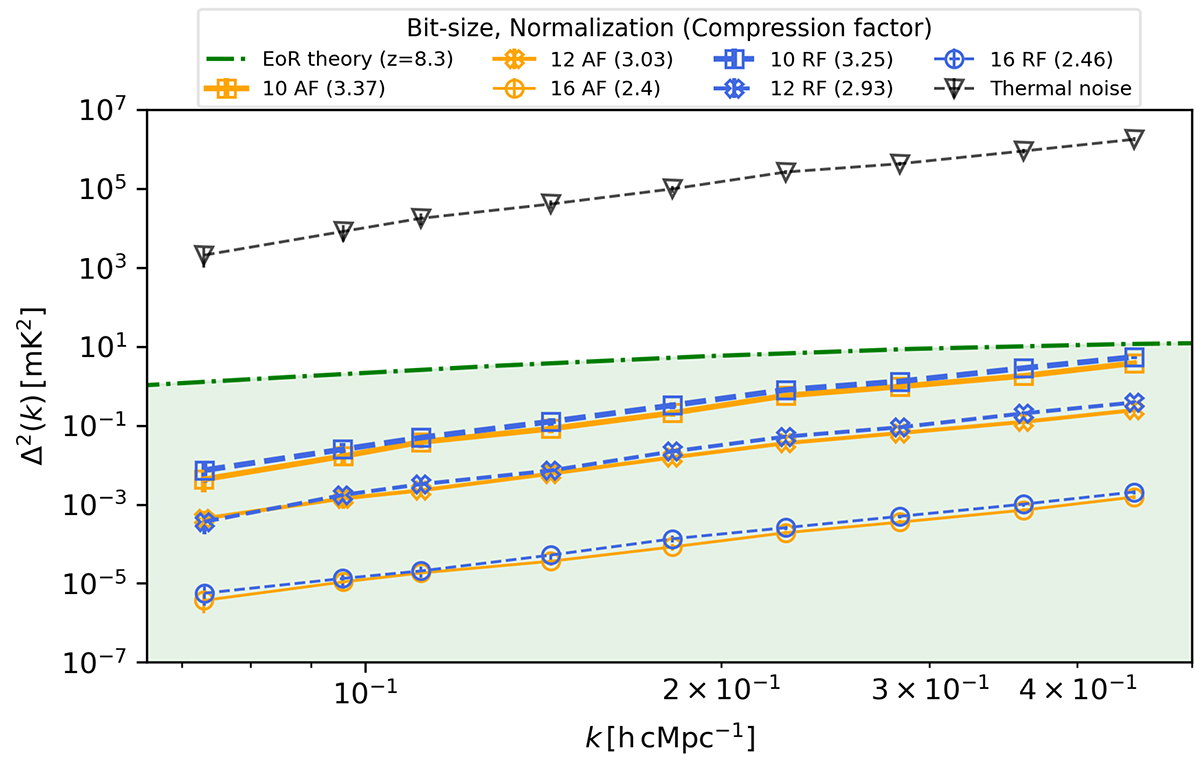
Fig. 8.
Download original image
Comparison of the compression error levels to the spherically averaged power spectrum and the compression factors, for different bit sizes and normalization methods. Orange and blue lines represent AF and RF normalization methods, respectively, with the three thickness levels and markers representing the bit sizes from 10 (thickest line with square markers) to 16 (thinnest line with circle markers). The green line shows a representative spherically averaged power spectrum from a simulated 21 cm model at z = 8.3. Compression errors from all settings are below the 21 cm signal, even from a relatively small 6-hour dataset. Since the compression noise is shown to be incoherent, a deeper data integration of, for example, 1000 hours will result in a compression noise level that is 1000 times lower for all settings. The compression factors obtained for each setting are shown in brackets in the legend.
Current usage metrics show cumulative count of Article Views (full-text article views including HTML views, PDF and ePub downloads, according to the available data) and Abstracts Views on Vision4Press platform.
Data correspond to usage on the plateform after 2015. The current usage metrics is available 48-96 hours after online publication and is updated daily on week days.
Initial download of the metrics may take a while.