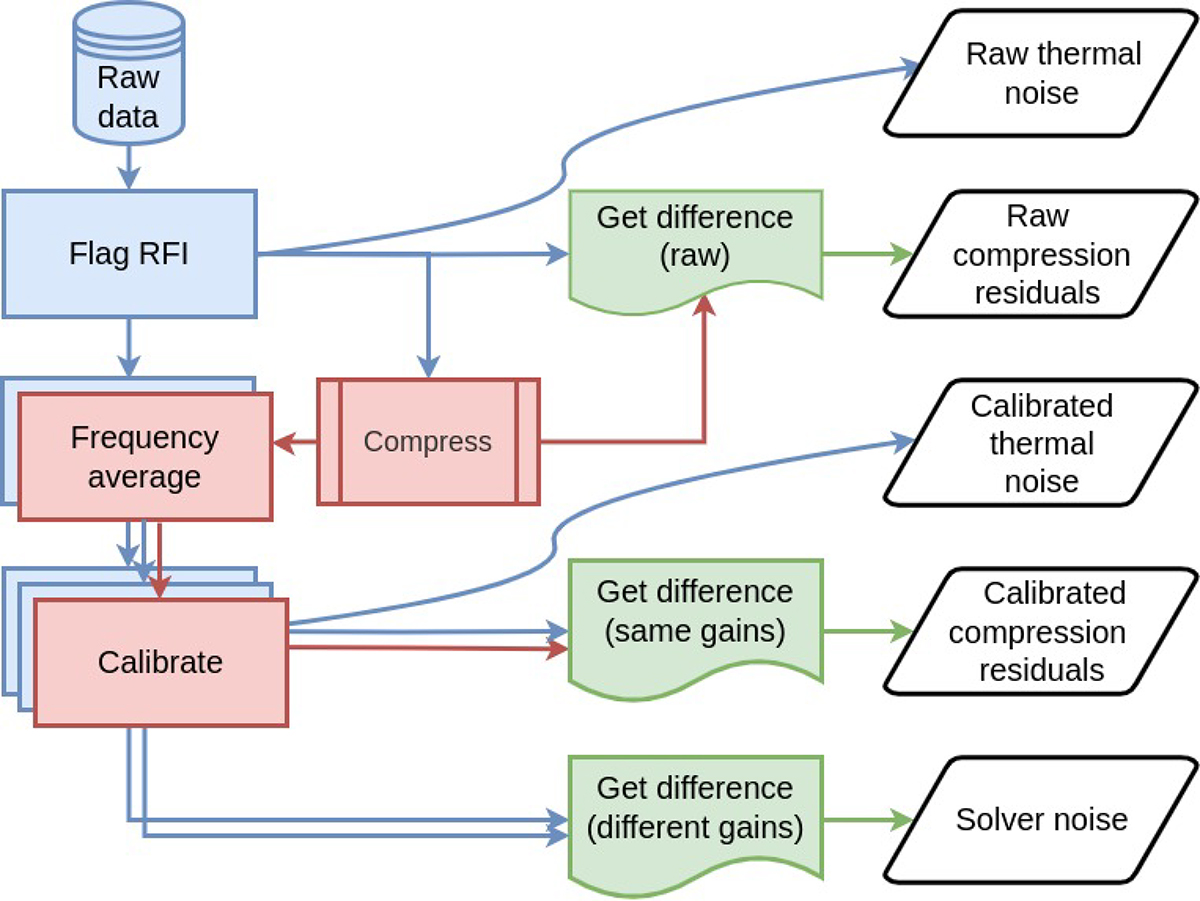
Fig. 1.
Download original image
Processing flow for the different visibility products used to obtain the compression residual noise, thermal noise, and solver noise power spectra displayed in Figs. 2 and 3. The flow of compressed and uncompressed data is indicated in blue and red, respectively, while different residuals are shown in green. Overlapping panels imply steps carried out multiple times on different datasets or on the same dataset). The two curved lines represent the thermal noise variance obtained as the difference of even-odd timestep image data. The exact details involved in each step are described in the text.
Current usage metrics show cumulative count of Article Views (full-text article views including HTML views, PDF and ePub downloads, according to the available data) and Abstracts Views on Vision4Press platform.
Data correspond to usage on the plateform after 2015. The current usage metrics is available 48-96 hours after online publication and is updated daily on week days.
Initial download of the metrics may take a while.