Fig. 7
Download original image
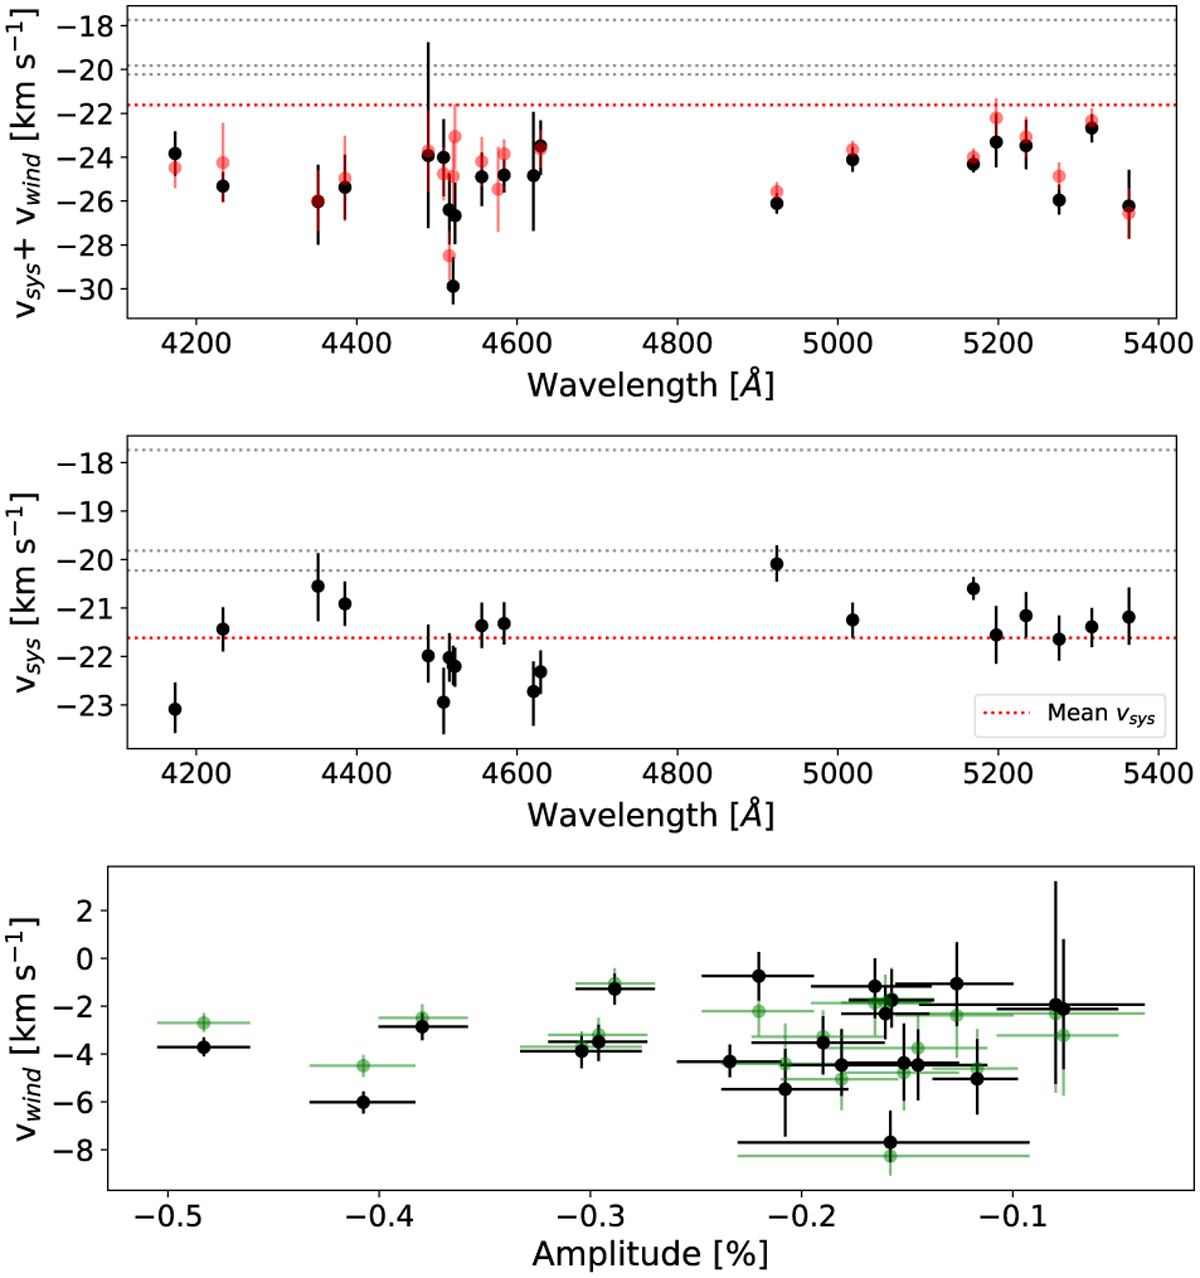
vsys+wind and vsys of the Fe II lines detected in atmosphere of KELT-9b. Top panel: fitted vsys+wind for each of the detected lines. The red dots represent the results of D’Arpa et al. (2024). Middle panel: fitted vsys for each of the detected lines. The red dashed horizontal lines indicate the mean value of the vsys = −21.61 ± 0.77 km s−1, while the grey horizontal dashed lines indicate literature vsys values: −17.74 ± 0.11 km s−1 (Hoeijmakers et al. 2019), −19.819 ± 0.024 km s−1 (Borsa et al. 2019), and −20.22 ± 0.49 km s−1 (Gaia). Bottom panel: vwind versus amplitude plot, where green points represent the values calculated by correcting the fitted vsys+wind by the mean vsys and the black points represent the values corrected by vsys fitted for each of the lines separately.
Current usage metrics show cumulative count of Article Views (full-text article views including HTML views, PDF and ePub downloads, according to the available data) and Abstracts Views on Vision4Press platform.
Data correspond to usage on the plateform after 2015. The current usage metrics is available 48-96 hours after online publication and is updated daily on week days.
Initial download of the metrics may take a while.