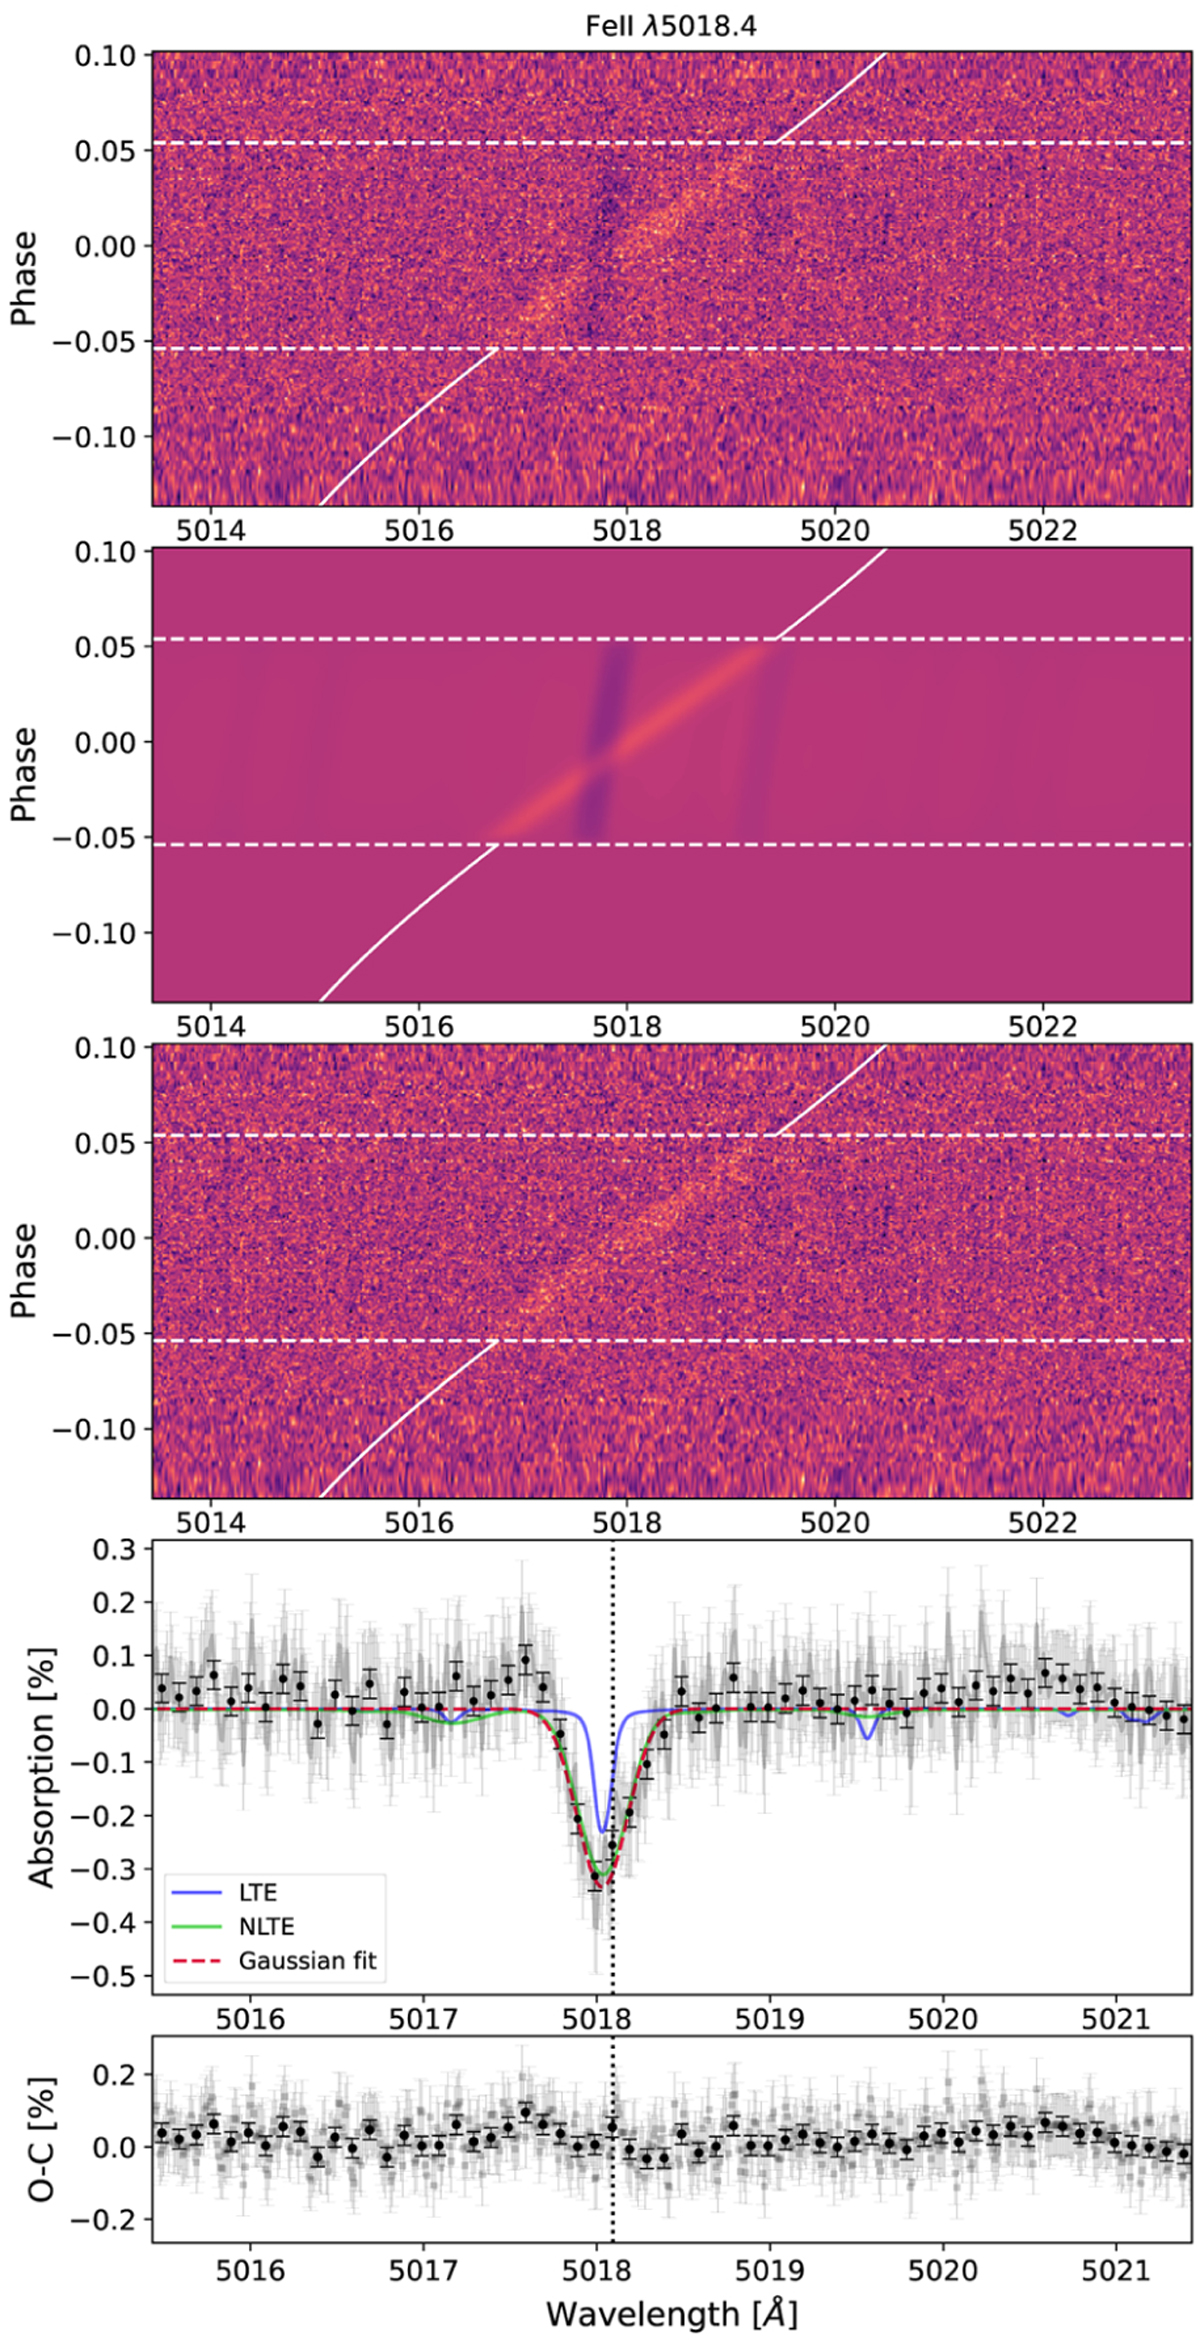
Fig. 5
Download original image
The results of the analysis of the Fe II line at λ5018.4 Å for KELT-9b. Top panel: residual map in the stellar rest frame. The light- tilted signal is the atmospheric signal of Fe II, while the dark almost vertical signal is the RM effect. The white horizontal lines indicate the start and end of the transit, while the tilted white line indicates the expected trace of the Fe II line considering velocities coming from the planet’s atmosphere, assuming vsys = −21.61 km s−1 as the average vsys from our analysis. Second panel: best-fit model of the planetary signal and of the RM and CLV effects. Third panel: same as the top panel, but with the RM and CLV effects corrected. Fourth panel: transmission spectrum of the detected line (gray dots). The black dots indicate the binned transmission spectrum with a step of 0.1 Å. The red line is the best Gaussian fit of the planetary signal derived from the MCMC analysis, the blue line shows the LTE model, and the green line indicates the NLTE model. Bottom panel: residuals after removing Gaussian fit from the TS.
Current usage metrics show cumulative count of Article Views (full-text article views including HTML views, PDF and ePub downloads, according to the available data) and Abstracts Views on Vision4Press platform.
Data correspond to usage on the plateform after 2015. The current usage metrics is available 48-96 hours after online publication and is updated daily on week days.
Initial download of the metrics may take a while.