Open Access
Fig. 3
Download original image
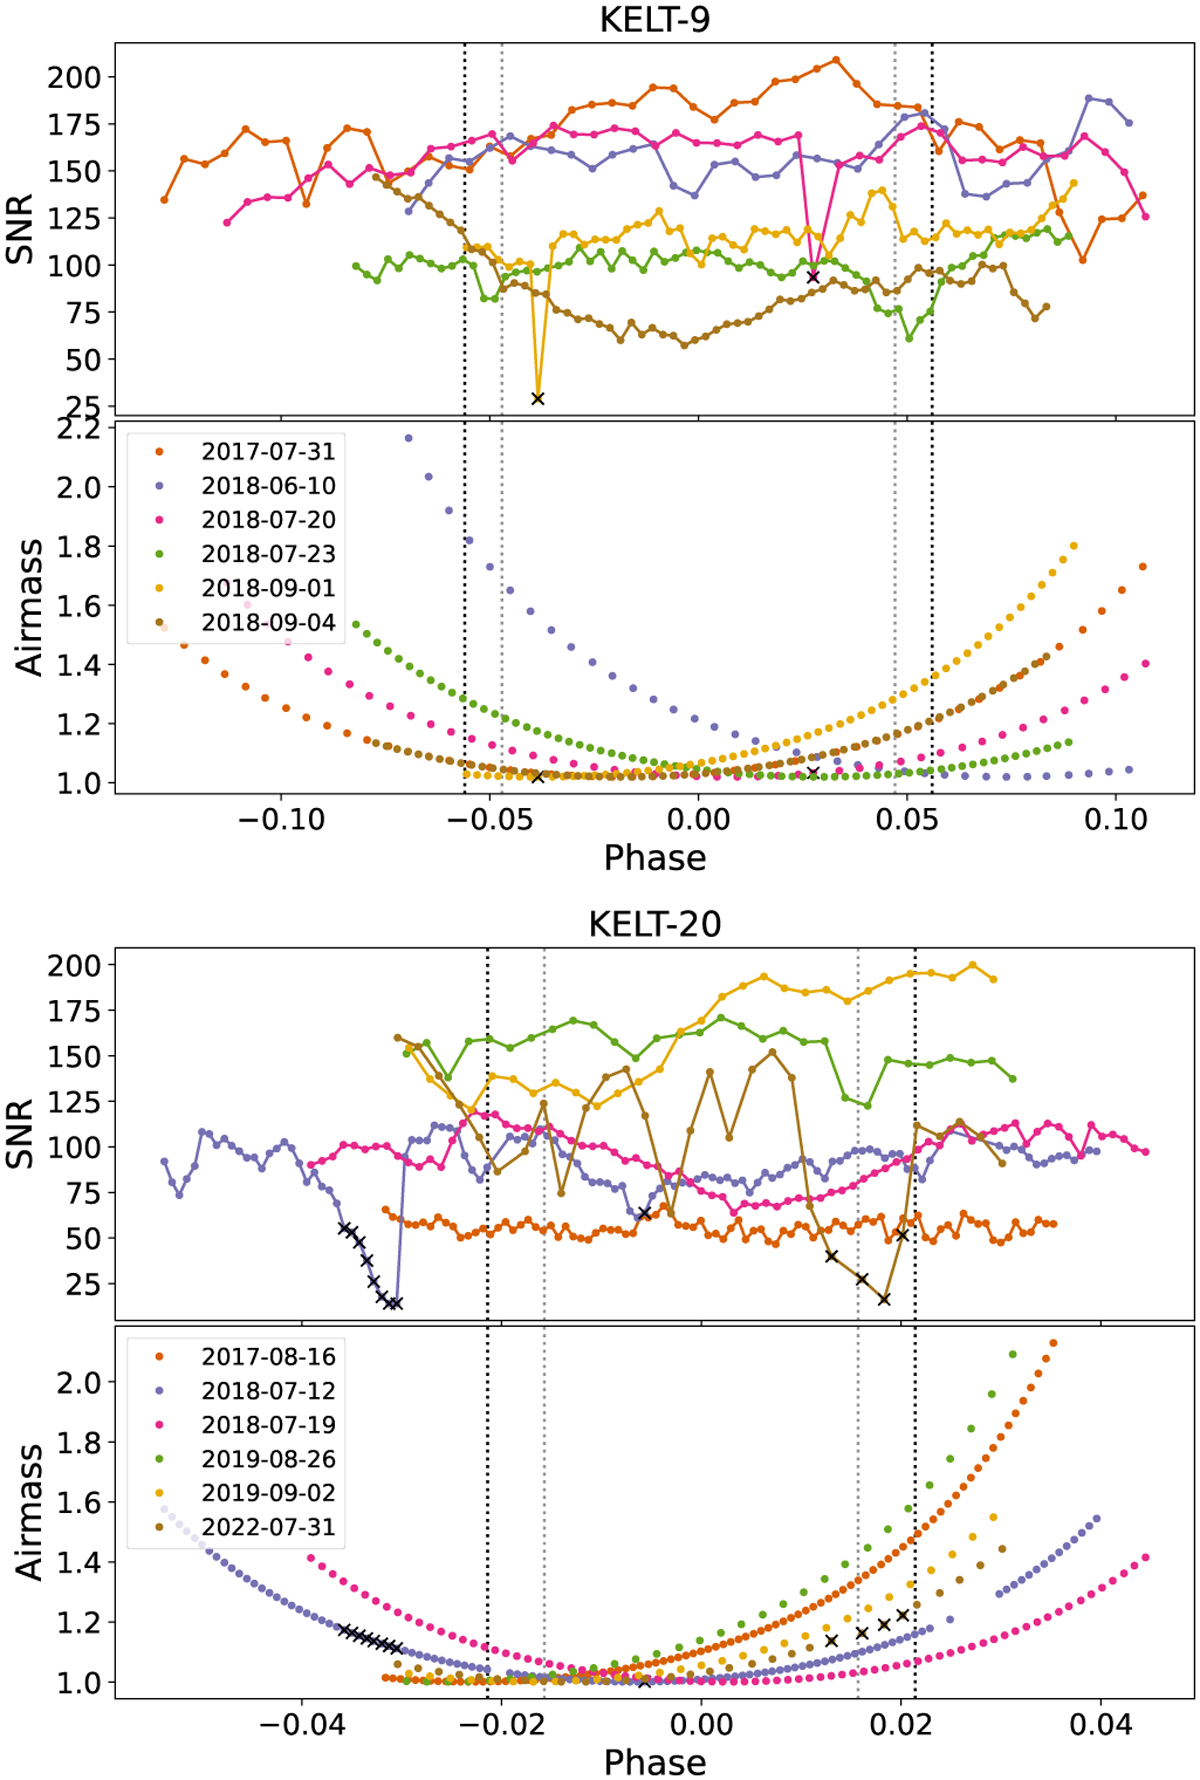
Changes in S/N and airmass during the observations of KELT-9b (upper panel) and KELT-20b (lower panel). The black vertical dotted lines indicate T1 and T4, and the gray vertical dotted lines indicate T2 and T3. The black crosses indicate the low S/N spectra that were excluded from the analysis.
Current usage metrics show cumulative count of Article Views (full-text article views including HTML views, PDF and ePub downloads, according to the available data) and Abstracts Views on Vision4Press platform.
Data correspond to usage on the plateform after 2015. The current usage metrics is available 48-96 hours after online publication and is updated daily on week days.
Initial download of the metrics may take a while.